In this month’s analysis, we turn our attention to the Swarm network’s performance in December, comparing it with previous months to draw insights into evolving trends and developments. Our report delves into key metrics such as total monthly rewards, median and average win values, and the average earnings per active staking node. Notably, we’ll discuss the network’s adaptation to an increasingly competitive staking landscape, highlighting the resilience and efficiency of Swarm’s economic model and pricing mechanism.
Data Considerations
The definitions of active staking nodes has reverted to nodes which have submitted a commit transaction at least within the month. See below for more details.
Network Total Monthly Rewards
This metric shows the total rewards paid out across the entire network for each month.
| Month | Total Network Rewards (xBZZ) |
|---|---|
| July | 34,839 |
| August | 13,5927 |
| September | 147,825 |
| October | 152,868 |
| November | 148,617 |
| December | 159,865 |
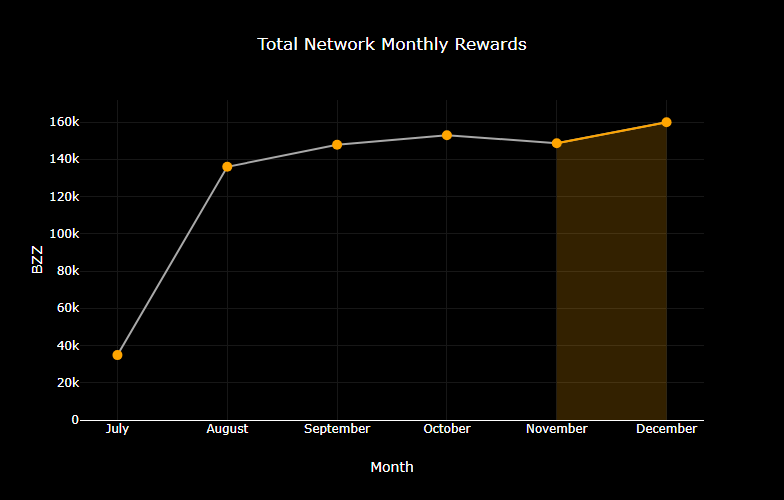
In December, a record 159,865 xBZZ in rewards was issued to node operators, representing a moderate increase in network utilisation. This growth in winnings, fuelled by demand for data storage services, demonstrates a continuing trend of growth in network utilisation.
Monthly Median Win Values
This metric is the median win amount for each win event.
| Month | Median Win Values (xBZZ) |
|---|---|
| July | 9.63 |
| August | 43.97 |
| September | 44.62 |
| October | 46.84 |
| November | 46.83 |
| December | 48.06 |
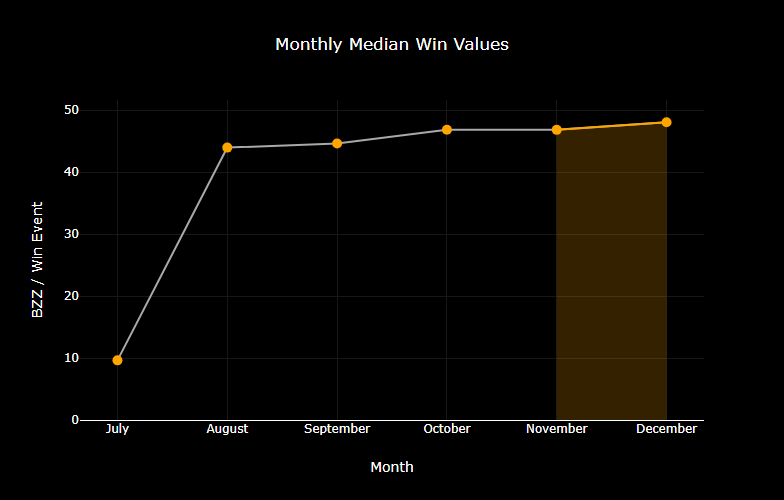
December saw a slight increase in the median win value to 48.06 xBZZ, demonstrating a consistent pattern in average reward size for win events.
Monthly Average Win Values
This metric is the average win amount for each win event.
| Month | Average Win Values (xBZZ) |
|---|---|
| July | 12.07 |
| August | 41.45 |
| September | 46.52 |
| October | 62.09 |
| November | 47.41 |
| December | 57.75 |
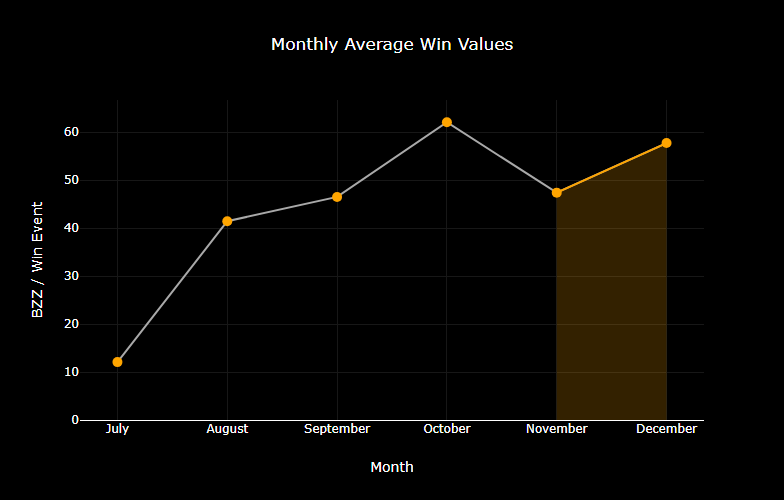
The average win value in December climbed to 57.75 xBZZ, reflecting an increase from November.
Total Active Staking Nodes by Month
This metric shows the total nodes actively staking each month, as measured by whether the node has submitted a commit transaction within the month. Due to network churn, and as there may be some neighbourhoods not chosen to issue commit transactions for the given month, this metric may not capture every single node which is operating on the network within the month. It is however a very valuable metric for understanding trends in network dynamics and is a good representation of the actual state of the network.
| Month | Total Active Staking Nodes |
|---|---|
| July | 2,657 |
| August | 4,368 |
| September | 4,574 |
| October | 10,367 |
| November | 18,297 |
| December | 12,891 |
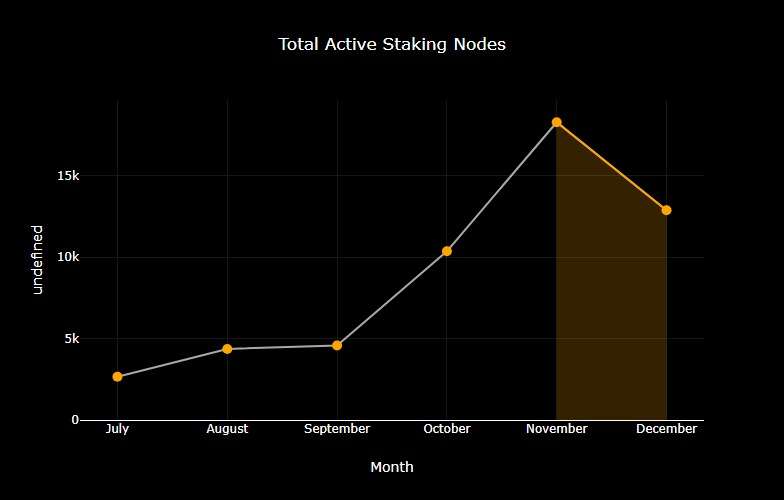
December saw a reduction in the number of active staking nodes to 12,891. See the section on staking nodes by country later in this article for a more detailed breakdown of the global changes in staking nodes.
Active Node Monthly Average Earnings
This metric shows the average monthly earnings for a participating staking node.
| Month | Avg Total Earnings per Node (xBZZ) |
|---|---|
| July | 13.11 |
| August | 31.11 |
| September | 32.31 |
| October | 14.73 |
| November | 8.12 |
| December | 12.40 |
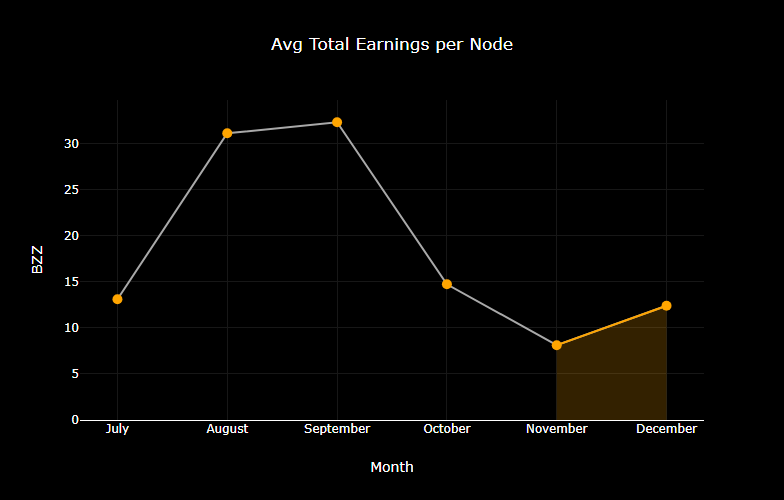
December observed an increase in average earnings per active staking node to 12.40 xBZZ. This rise, amidst a decrease in the total number of nodes, is demonstrative of the network’s economic model adapting in response to an increase in staking competition.
Total Winning Nodes by Month
This metric shows the total number of unique active staking nodes which have won at least once within the month.
| Month | Total Winning Nodes |
|---|---|
| July | 1,541 |
| August | 1,993 |
| September | 2,125 |
| October | 2,462 |
| November | 2,787 |
| December | 2,308 |
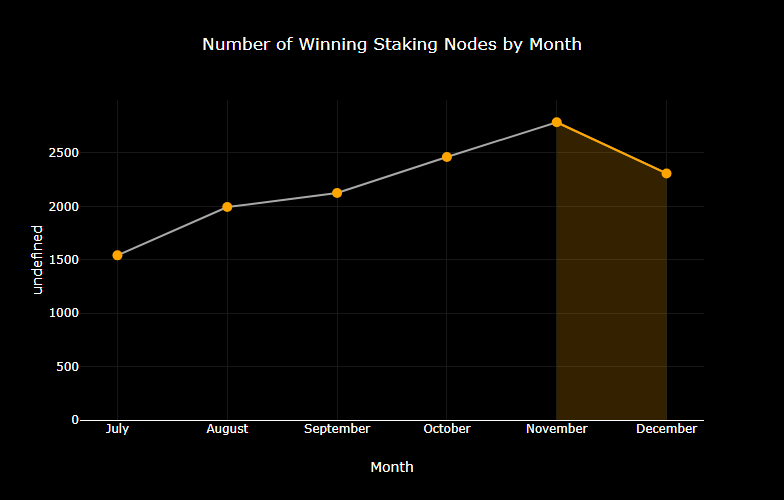
While November marked a peak with 2,787 winning nodes, December saw a decrease to 2,308. This is reflective of the decrease in total staking nodes for this month.
Total Active Staking Nodes by Country
This metric shows the total number of active staking nodes across various countries.
| China | Germany | Finland | Unknown | United States | Other | |
|---|---|---|---|---|---|---|
| July | 1,172 | 445 | 630 | 224 | 7 | 179 |
| August | 855 | 1,481 | 1,611 | 267 | 7 | 147 |
| September | 574 | 2,046 | 1,607 | 217 | 8 | 123 |
| October | 6,242 | 2,042 | 1,543 | 175 | 282 | 91 |
| November | 14,270 | 1,976 | 1,531 | 113 | 344 | 63 |
| December | 8,333 | 2,001 | 1,919 | 265 | 312 | 61 |
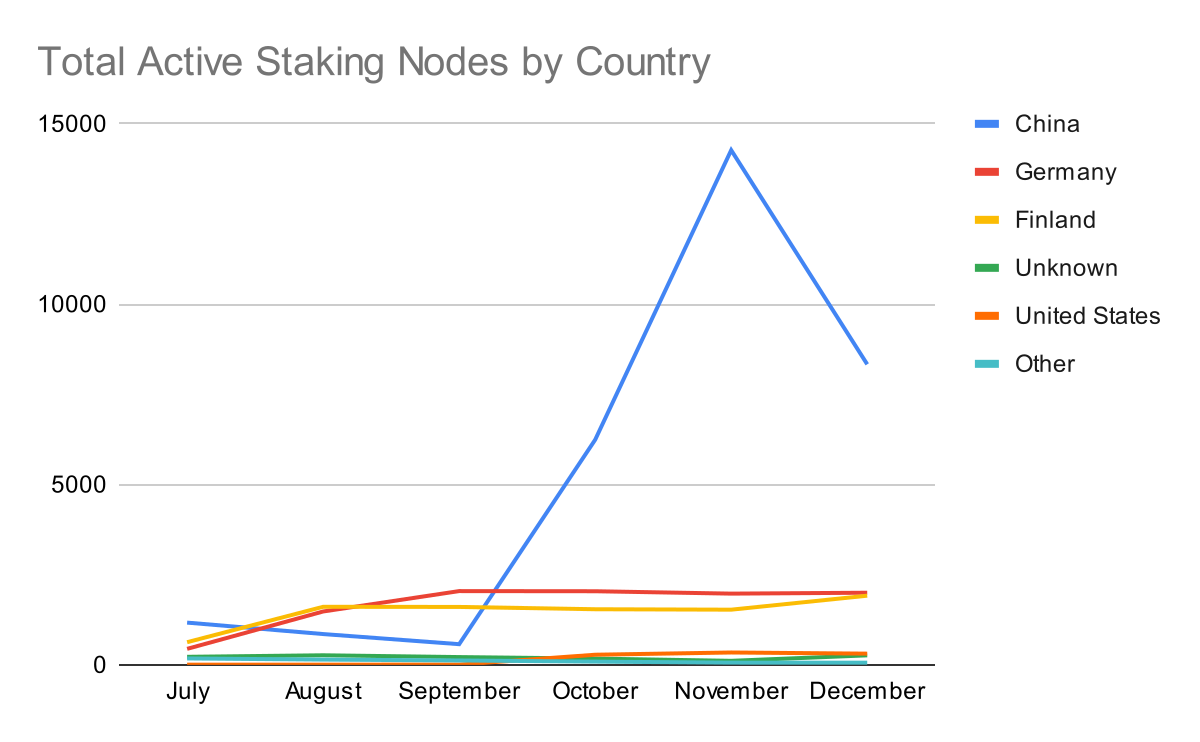
In December, there was a notable reshuffling in the distribution of active staking nodes, with a significant reduction in China and smaller adjustments across other regions. This redistribution reflects the network’s dynamic nature and continually evolving global footprint.
Conclusion
Over the last six months, the Swarm network has shown considerable resilience and adaptability. The shifts in total monthly rewards, win values, and the average earnings per node underscore a network that is not only growing but also evolving in its economic dynamics and network utilisation. The changing landscape of active nodes across different countries highlights Swarm’s influence in the decentralized storage space. These developments point towards an active, expanding, and diversifying network.
Discussions about Swarm can be found on Reddit.
All tech support and other channels have moved to Discord!
Please feel free to reach out via info@ethswarm.org
Join the newsletter! .