In this detailed analysis, we focus on the Swarm network’s performance in November, placing it in context with data from recent months to highlight trends and changes. This report explores a variety of critical metrics, including total monthly rewards, median and average win values, and the average earnings per active staking node. We also delve into the increasing number of active staking nodes, examining their distribution globally.
Data Considerations
The definition for active staking has been reverted to nodes which have submitted at least one commit transaction within the month in question, relevant figures have been updated accordingly. (Edit - 1/15/24)
The “Active staking node” metric has been redefined as any full node with a greater than zero reserve size at some point in the month. This has not been retroactively applied to past months.
Network Total Monthly Rewards
This metric shows the total rewards paid out across the entire network for each month.
| Month | Total Network Rewards (xBZZ) |
|---|---|
| June | 26,655 |
| July | 34,839 |
| August | 13,5927 |
| September | 147,825 |
| October | 152,868 |
| November | 148,617 |
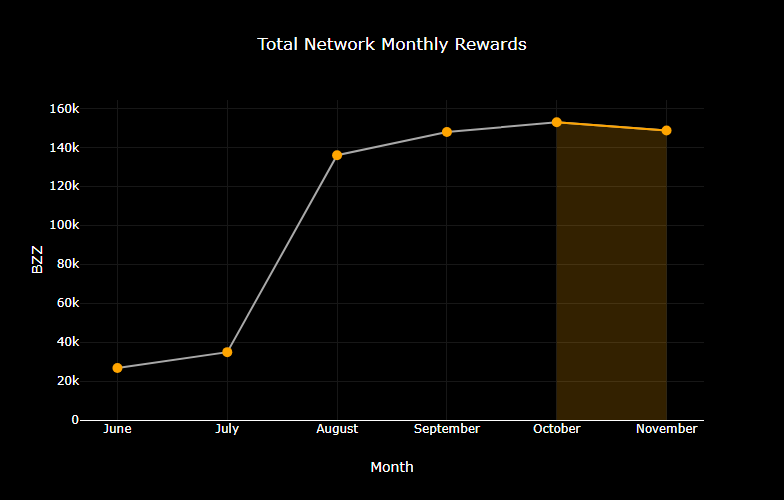
In November, the Swarm network distributed a total of 148,617 xBZZ in rewards. While this marks a slight decrease from October’s peak, it still represents one of the higher monthly payouts, reflecting sustained network activity and engagement.
Monthly Median Win Values
This metric is the median win amount for each win event.
| Month | Median Win Values (xBZZ) |
|---|---|
| June | 8.29 |
| July | 9.63 |
| August | 43.97 |
| September | 44.62 |
| October | 46.84 |
| November | 46.83 |
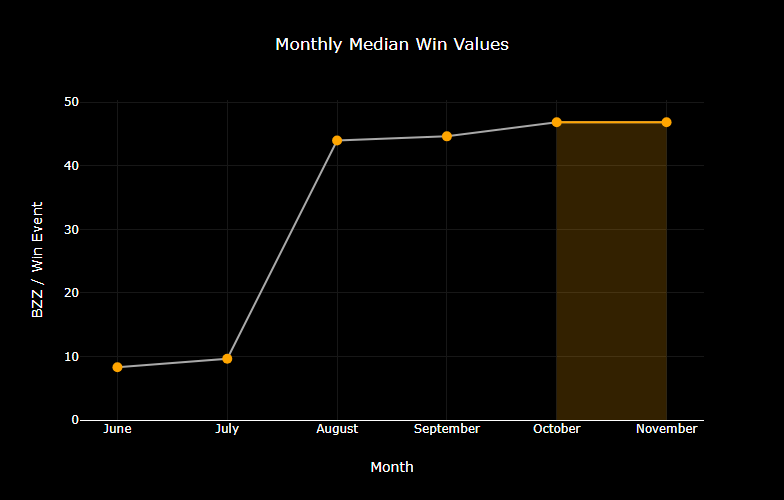
The median win value in November was 46.83 xBZZ, closely paralleling October’s value. This consistency in median values suggests a stable and significant reward size for typical win events in the network.
Monthly Average Win Values
This metric is the average win amount for each win event.
| Month | Average Win Values (xBZZ) |
|---|---|
| June | 10.14 |
| July | 12.07 |
| August | 41.45 |
| September | 46.52 |
| October | 62.09 |
| November | 47.41 |
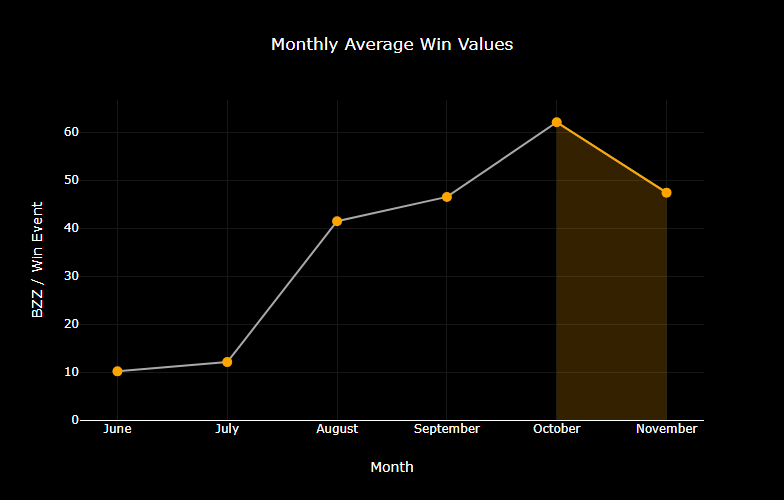
For November, the average win value was 47.41 xBZZ. This indicates a slight decrease from October’s all-time high but still shows a substantial value, signifying robust individual win events and consistent network participation.
Active Staking Node Monthly Average Earnings
This metric shows the average monthly earnings for an active staking node.
| Month | Avg Total Earnings per Node (xBZZ) |
|---|---|
| June | 10.73 |
| July | 13.11 |
| August | 31.11 |
| September | 32.31 |
| October | 14.73 |
| November | 8.12 |
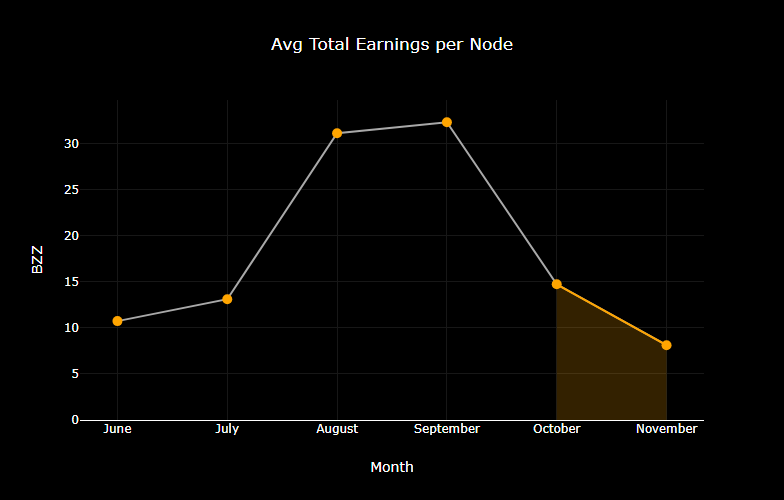
In November, the average earnings per active staking node decreased to 8.12 xBZZ. The decrease in average earnings per node is reflective of the recent dramatic growth in the number of active staking nodes, perhaps reflecting growing interest in the Swarm network from node operators.
Total Active Staking Nodes by Month
This metric shows the total active staking nodes by month.
| Month | Total Active Staking Nodes |
|---|---|
| June | 2,482 |
| July | 2,657 |
| August | 4,368 |
| September | 4,574 |
| October | 10,367 |
| November | 18,297 |
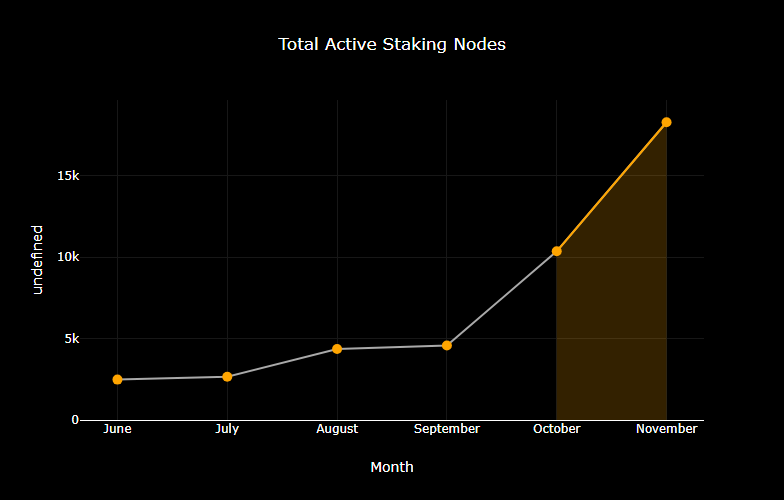
November saw a significant increase in active staking nodes, rising to 18,297, which is a growth of just over 100% from the previous month. This continues the recent trend of rapid growth in the number of active staking nodes.
Total Winning Nodes by Month
This metric shows the total number of unique active staking nodes which have won at least once within the month.
| Month | Total Winning Nodes |
|---|---|
| June | 1,415 |
| July | 1,541 |
| August | 1,993 |
| September | 2,125 |
| October | 2,462 |
| November | 2,787 |
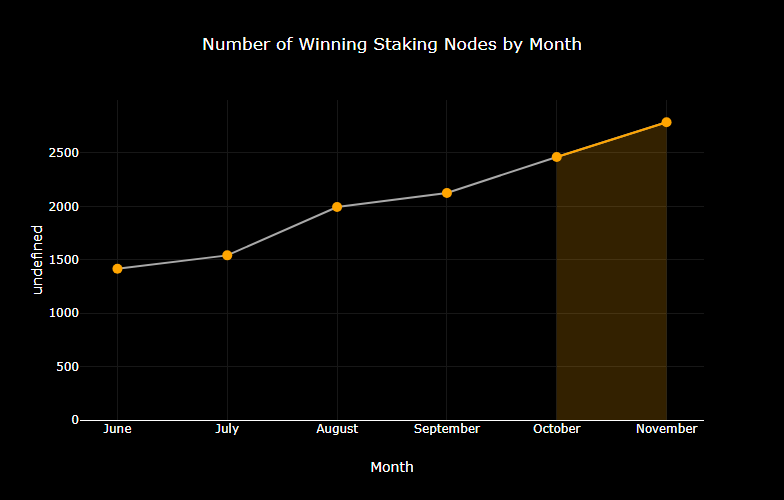
November saw a new peak with 2,787 unique active staking nodes winning at least once, continuing the upward trend observed in recent months. Note that there are a total of approximately 3,450 chances to win each month, which puts a ceiling on the possible total winning nodes per month.
Total Active Staking Nodes by Country
This metric shows the total number of active staking nodes across the top four countries and all other countries aggregated into the “Other” category, as well as the remaining nodes in the “Unknown” category.
| China | Germany | Finland | Unknown | United States | Other | |
|---|---|---|---|---|---|---|
| June | 1,062 | 409 | 609 | 230 | 9 | 163 |
| July | 1,172 | 445 | 630 | 224 | 7 | 179 |
| August | 855 | 1,481 | 1,611 | 267 | 7 | 147 |
| September | 574 | 2,046 | 1,607 | 217 | 8 | 123 |
| October | 6,242 | 2,042 | 1,543 | 175 | 282 | 91 |
| November | 14,270 | 1,976 | 1,531 | 113 | 344 | 63 |
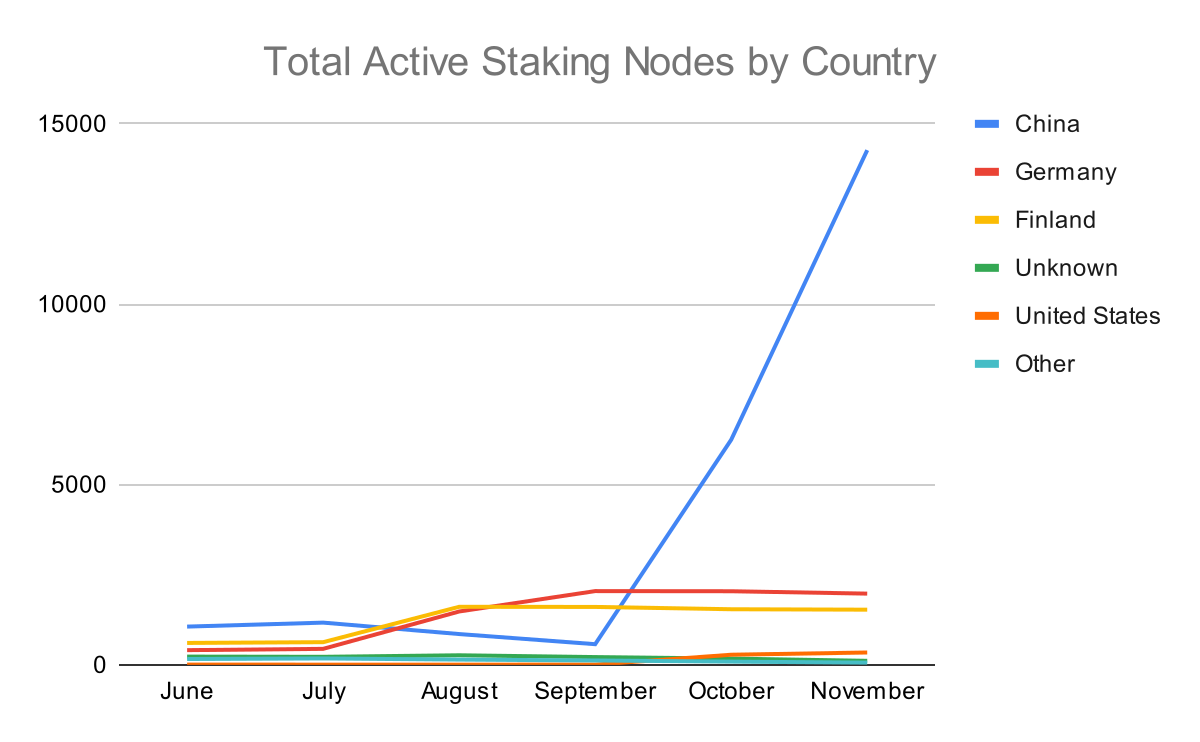
November observed a shift in the distribution of active staking nodes across countries, with China continuing to lead and experiencing a significant increase in node growth. Notably, Finland and the USA also saw moderate increases in node counts since October. This shift reflects the dynamic and evolving geographic distribution of network participants.
Conclusion
The Swarm network has demonstrated remarkable growth and vitality over the past six months, as evidenced by the evolving total monthly rewards, average and median win values, and the earnings per active staking node. The number of active nodes, both staking and non-staking, has continued to rise, signalling a growing global interest in the Swarm network. These trends not only signify an active and expanding network but also highlight the evolving nature of the Swarm ecosystem and its increasing significance in the decentralised storage space.
Discussions about Swarm can be found on Reddit.
All tech support and other channels have moved to Discord!
Please feel free to reach out via info@ethswarm.org
Join the newsletter! .