September 2025 State of the Network Report
September marked a month of recalibration for the Swarm network, following two strong months of growth in July and August. While total rewards and win values adjusted downward from August’s peak, the network maintained strong participation levels, and both active and reachable node counts remained stable. This steady participation suggests that while payouts have normalized, the network continues to sustain a broad and active operator base after the summer’s surge.
Network Total Monthly Rewards
This metric shows the total storage incentive rewards paid out across the entire network for each month.
| Month | Total Network Rewards (xBZZ) |
|---|---|
| April | 24,441 |
| May | 27,851 |
| June | 24,545 |
| July | 37,249 |
| August | 41,496 |
| September | 28,162 |
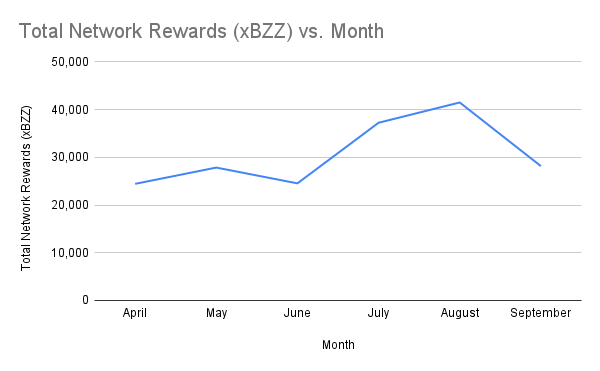
After two consecutive months of growth, total rewards in September settled at 28,162 xBZZ, returning closer to levels seen in spring. This reflects a normalization of incentives following the elevated payouts in July and August.
Monthly Median Win Values
This metric shows the median win amount for each win event, providing insight into the typical reward nodes can expect from a single win.
| Month | Median Win Values (xBZZ) |
|---|---|
| April | 7.21 |
| May | 8.12 |
| June | 7.38 |
| July | 10.00 |
| August | 11.07 |
| September | 8.33 |
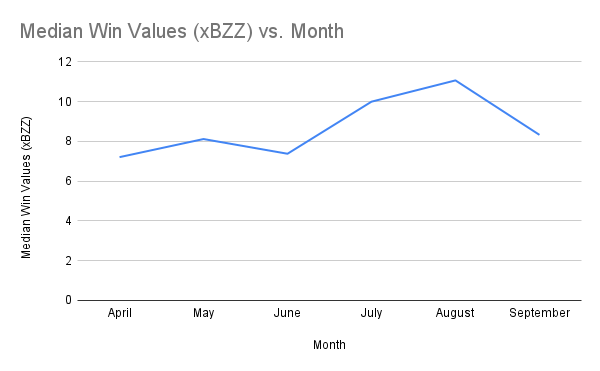
Median win values declined from August’s high, landing at 8.33 xBZZ. This remains notably higher than earlier in the year, indicating more consistent per-win rewards compared to the spring months.
Monthly Average Win Values
This metric shows the average win amount for each win event, offering insight into how reward amounts are distributed across the network.
| Month | Average Win Values (xBZZ) |
|---|---|
| April | 7.51 |
| May | 8.24 |
| June | 7.44 |
| July | 11.07 |
| August | 12.28 |
| September | 8.60 |
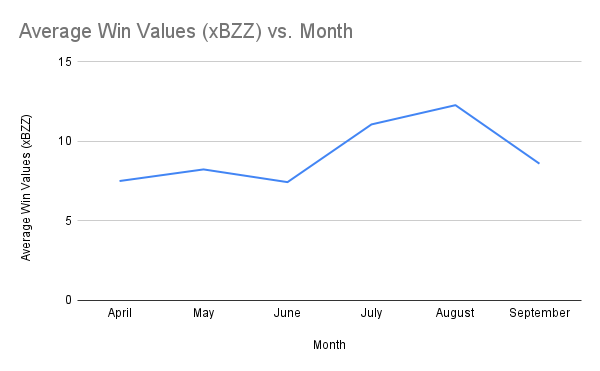
Average win values followed a similar pattern to total rewards, declining from the August peak but remaining well above levels seen in the spring. This indicates payouts per win are still relatively strong, even with lower overall rewards.
Active Staking Node Monthly Average Earnings
This metric shows the average monthly earnings for an active staking node, with an “active node” defined as a node that has submitted at least one commit transaction during the month.
| Month | Avg Total Earnings per Node (xBZZ) |
|---|---|
| April | 4.88 |
| May | 5.28 |
| June | 4.97 |
| July | 10.79 |
| August | 11.33 |
| September | 7.73 |
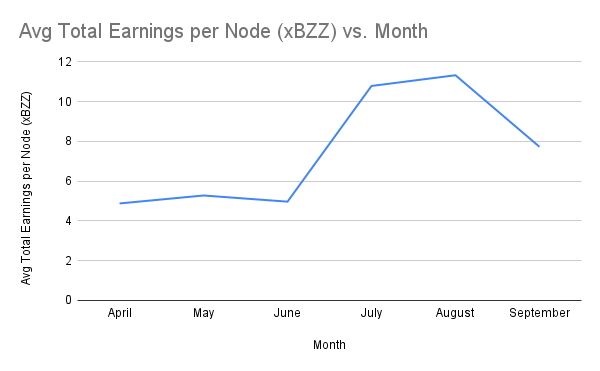
Average earnings per active node decreased to 7.73 xBZZ in September but remained well above levels from earlier in the year, showing that node operators continue to earn more on average than during spring’s lower reward periods.
Total Active Staking Nodes by Month
This metric shows the total number of active staking nodes, defined as full nodes that have issued at least one commit transaction during the month. This is distinct from the “active node” count on Swarmscan, which includes all “nodes that can connect to and exchange protocol messages.”
| Month | Total Active Staking Nodes |
|---|---|
| April | 5,008 |
| May | 5,277 |
| June | 4,934 |
| July | 3,453 |
| August | 3,663 |
| September | 3,643 |
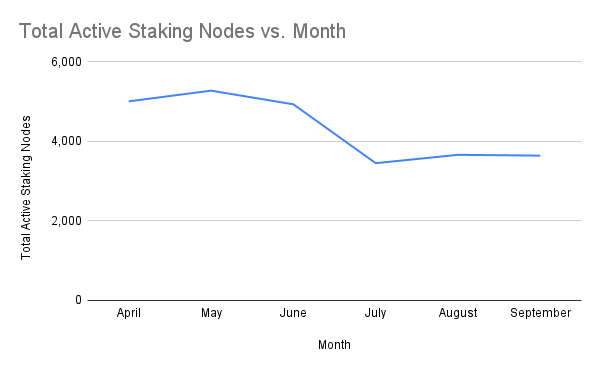
Active staking node counts held steady at 3,643, almost unchanged from August. This stability suggests that recent fluctuations in rewards have not significantly impacted participation.
Total Reachable Full Nodes Regardless of Active Status
This metric counts the total number of unique full nodes (as determined by unique blockchain address) that were reachable at any point in the month, providing a broader picture of network activity beyond just active committers. This is more in line with the “active node” count found on Swarmscan.
| Month | Total Reachable Full Nodes |
|---|---|
| April | 12,054 |
| May | 9,371 |
| June | 8,473 |
| July | 9,753 |
| August | 7,097 |
| September | 7,063 |
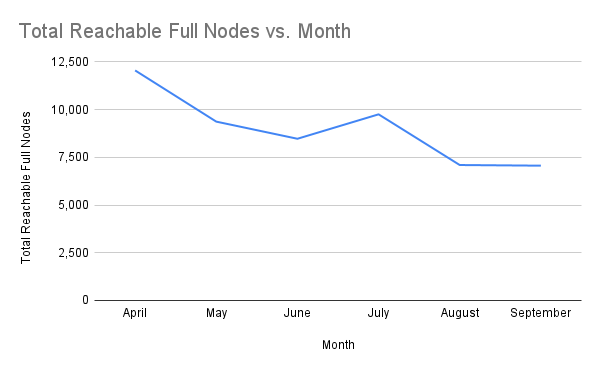
Reachable full nodes remained stable at 7,063, essentially matching August’s count. After several months of fluctuation, this plateau may indicate a more consistent baseline level of network participation and connectivity.
Total Winning Nodes by Month
This metric tracks the number of unique staking nodes that won the redistribution game at least once during the month.
| Month | Total Winning Nodes |
|---|---|
| April | 2,197 |
| May | 2,052 |
| June | 2,197 |
| July | 1,806 |
| August | 1,738 |
| September | 1,701 |
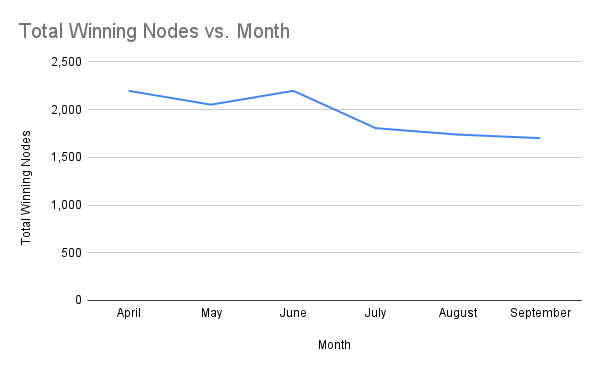
The number of winning nodes declined slightly to 1,701, continuing the gentle downward trend observed since July. Despite this, participation levels remain broad, with a large share of nodes still winning at least once per month.
Total Active Staking Nodes by Country
This metric shows the total number of active staking nodes globally for the month of September 2025.
| Country | Unique txSenders |
|---|---|
| China | 1,909 |
| Finland | 1,669 |
| Unknown | 49 |
| Hungary | 5 |
| Estonia | 3 |
| United States | 3 |
| Germany | 2 |
| Japan | 1 |
| Martinique | 1 |
| Russia | 1 |
China and Finland remained the two dominant regions in September, together representing the vast majority of active staking nodes. Their relative shares were nearly balanced this month, with China maintaining a slight lead. Smaller but steady participation continued from a handful of other countries, illustrating that while the network is geographically concentrated, it still maintains a diverse operator base.
Conclusion
In summary, September saw rewards and win values return to more typical levels after the highs of July and August, while participation remained steady. China and Finland continued to anchor the network’s geographic distribution, reflecting a stable and engaged operator base that supports long-term network resilience.
Discussions about Swarm can be found on Reddit.
All tech support and other channels have moved to Discord!
Please feel free to reach out via info@ethswarm.org
Join the newsletter! .