May 2025 State of the Network Report
May saw a modest rebound in xBZZ-denominated rewards and node participation compared to April. Although some metrics remained below their earlier peaks, the network demonstrated signs of stabilization.
Network Total Monthly Rewards
This metric shows the total storage incentives rewards paid out across the entire network for each month.
| Month | Total Network Rewards (xBZZ) |
|---|---|
| December | 36,521 |
| January | 29,976 |
| February | 27,350 |
| March | 39,853 |
| April | 24,441 |
| May | 27,851 |
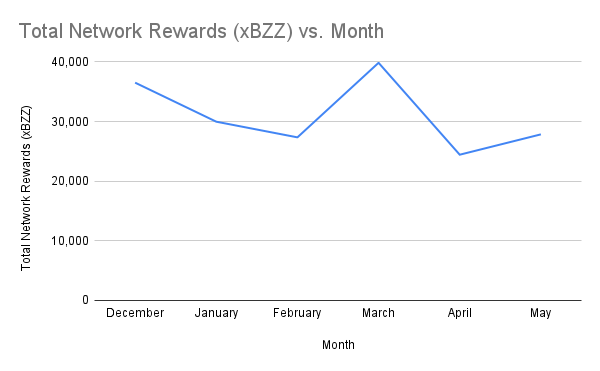
Total network rewards increased to 27,851 xBZZ in May, up 14% from April’s 24,441 xBZZ.
Monthly Median Win Values
This metric is the median win amount for each win event, providing insight into the typical reward nodes can expect from a single win event.
| Month | Median Win Values (xBZZ) |
|---|---|
| December | 9.93 |
| January | 8.48 |
| February | 8.54 |
| March | 11.73 |
| April | 7.21 |
| May | 8.12 |
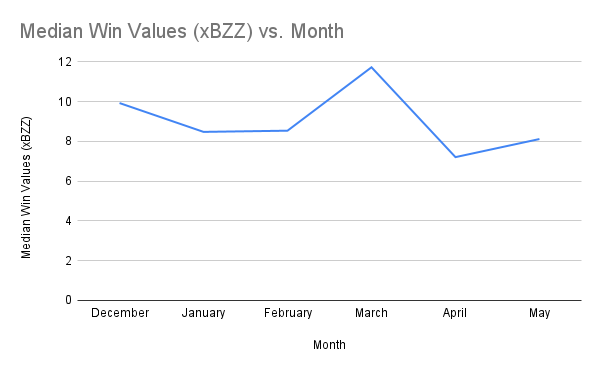
Median win values rose to 8.12 xBZZ in May, an increase of 12.6% from April’s 7.21 xBZZ.
Monthly Average Win Values
This metric shows the average win amount for each win event, offering an understanding of how the reward amounts are distributed across the network.
| Month | Average Win Values (xBZZ) |
|---|---|
| December | 11.15 |
| January | 9.13 |
| February | 9.39 |
| March | 12.21 |
| April | 7.51 |
| May | 8.24 |
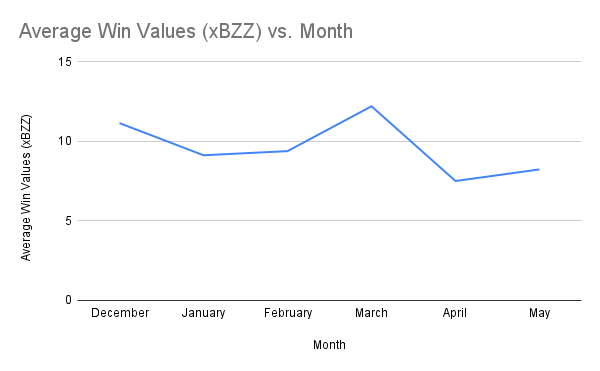
Average win values climbed to 8.24 xBZZ in May, up 9.7% from April’s 7.51 xBZZ.
Active Staking Node Monthly Average Earnings
This metric shows the average monthly earnings for an active staking node, with an “active node” defined as a node that has submitted at least one commit transaction during the month.
| Month | Avg Total Earnings per Node (xBZZ) |
|---|---|
| December | 4.69 |
| January | 4.10 |
| February | 4.19 |
| March | 7.02 |
| April | 4.88 |
| May | 5.28 |
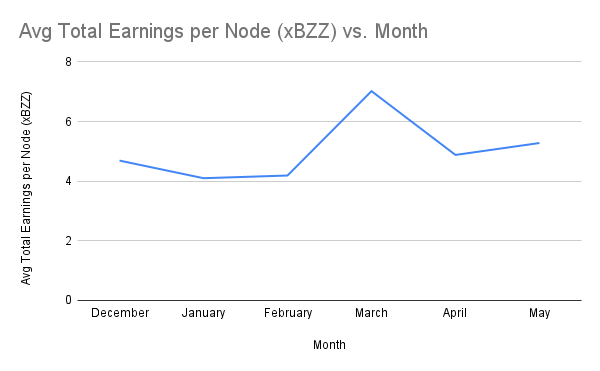
Average earnings per active staking node increased to 5.28 xBZZ, up 8.2% from April’s 4.88 xBZZ.
Total Active Staking Nodes by Month
This metric shows the total number of active staking nodes, defined as full nodes that have issued at least one commit transaction during the month.
| Month | Total Active Staking Nodes |
|---|---|
| December | 7,793 |
| January | 7,315 |
| February | 6,532 |
| March | 5,676 |
| April | 5,008 |
| May | 5,277 |
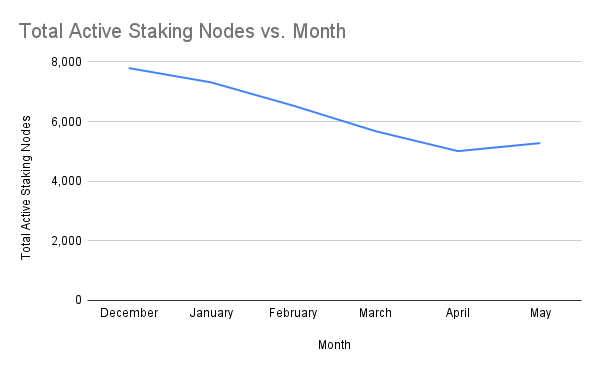
The number of active staking nodes rose to 5,277 in May, an increase of 5.4% from April’s 5,008.
Total Reachable Full Nodes Regardless of Active Status
This metric counts the total number of unique full nodes (as determined by unique blockchain address) that were reachable at any point in the month, providing a broader picture of network activity beyond just active committers.
| Month | Total Reachable Full Nodes |
|---|---|
| December | 15,007 |
| January | 12,240 |
| February | 12,858 |
| March | 13,481 |
| April | 12,054 |
| May | 9,371 |
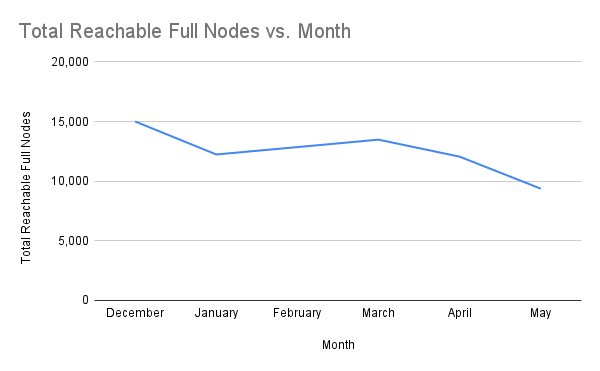
Reachable full nodes declined to 9,371 in May, down 22.2% from April’s 12,054.
Total Winning Nodes by Month
This metric tracks the number of unique staking nodes that won the redistribution game at least once during the month.
| Month | Total Winning Nodes |
|---|---|
| December | 2,611 |
| January | 2,547 |
| February | 2,203 |
| March | 2,253 |
| April | 2,197 |
| May | 2,052 |
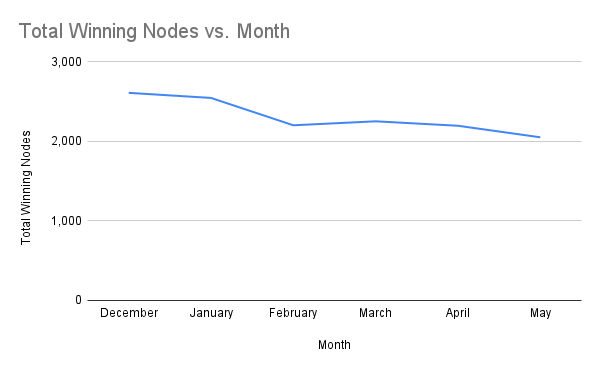
The number of winning nodes declined to 2,052 in May, down 6.6% from April’s 2,197.
Total Active Staking Nodes by Country
This metric shows the total number of active staking nodes globally for the month of May, 2025.
| Country | Unique txSenders |
|---|---|
| China | 2407 |
| Finland | 2000 |
| Germany | 336 |
| United Kingdom | 242 |
| United States | 149 |
| Canada | 18 |
| Vietnam | 17 |
| Australia | 13 |
| Unknown | 12 |
| Romania | 8 |
| India | 7 |
| Hungary | 7 |
| Spain | 7 |
| United Arab Emirates | 5 |
| Philippines | 3 |
| Estonia | 3 |
| Portugal | 3 |
| Slovenia | 3 |
| Japan | 3 |
| Mexico | 2 |
| Indonesia | 2 |
| Ukraine | 2 |
| France | 2 |
| The Netherlands | 2 |
| Russia | 2 |
| Taiwan | 2 |
| Switzerland | 2 |
| South Korea | 2 |
| Saudi Arabia | 2 |
| Peru | 2 |
| Hong Kong | 2 |
| Bangladesh | 2 |
| Nigeria | 1 |
| Greece | 1 |
| Türkiye | 1 |
| Nepal | 1 |
| Malaysia | 1 |
| Poland | 1 |
| Pakistan | 1 |
| Egypt | 1 |
The country-level distribution of active staking nodes in May remained stable, with China and Finland continuing to represent the largest share of the network.
Conclusion
May saw a moderate rebound in key network metrics, including total rewards, win values, average earnings per node, and active staking nodes. However, some metrics—such as reachable full nodes and total winning nodes—continued to decline. Overall, the network showed signs of resilience despite earlier declines, with continued participation across most major regions.
Discussions about Swarm can be found on Reddit.
All tech support and other channels have moved to Discord!
Please feel free to reach out via info@ethswarm.org
Join the newsletter! .