January 2025 State of the Network Report
As the new year begins, the network continues to exhibit evolving trends shaped by both seasonal factors and broader structural shifts. January data reflects a trend towards greater stability, with many metrics remaining roughly in line with those of the previous month. While rewards did continue to decrease, the rate of decrease has slowed significantly, and network participation from nodes remains relatively stable, reflecting continued dedication to the network.
Network Total Monthly Rewards
This metric shows the total rewards distributed across the entire network for each month.
| Month | Total Network Rewards (xBZZ) |
|---|---|
| August | 62,093 |
| September | 99,124 |
| October | 89,250 |
| November | 54,053 |
| December | 36,521 |
| January | 29,976 |
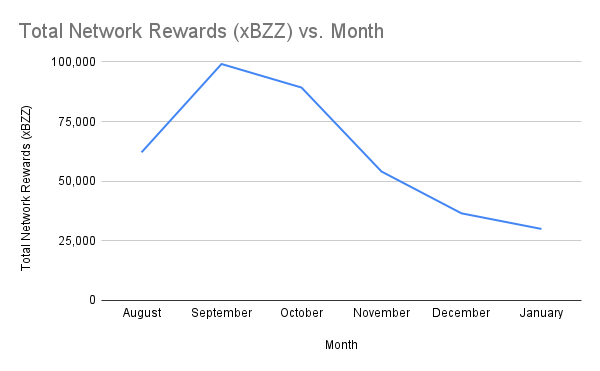
Total network rewards fell to 29,976 xBZZ, representing an 18% decline from December’s 36,521 xBZZ. While the downward trend continued, the rate of decline was less steep compared to previous months, suggesting a trend towards stabilization in reward distribution dynamics.
Monthly Median Win Values
This metric provides insights into the typical reward nodes can expect from a single win event.
| Month | Median Win Values (xBZZ) |
|---|---|
| August | 12.48 |
| September | 30.05 |
| October | 27.70 |
| November | 17.44 |
| December | 9.93 |
| January | 8.48 |
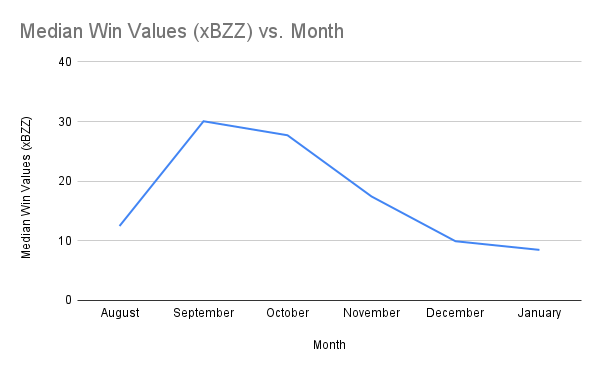
Median win values dropped to 8.48 xBZZ, a 14.6% decrease from December’s 9.93 xBZZ. This represents a more moderate decline than the previous month’s 43.1% drop, again suggesting a trend towards increasing stabilization.
Monthly Average Win Values
This metric shows the average reward amount for each win event across the network.
| Month | Average Win Values (xBZZ) |
|---|---|
| August | 19.44 |
| September | 32.58 |
| October | 28.07 |
| November | 17.13 |
| December | 11.15 |
| January | 9.13 |
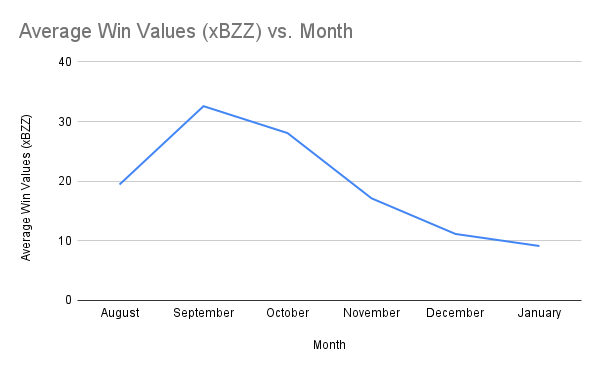
Average win values declined to 9.13 xBZZ, down 18.2% from December’s 11.15 xBZZ. Although this follows the overall downward trend, the decline was less sharp than the previous month, further showing signs of stabilization.
Active Staking Node Monthly Average Earnings
This metric tracks the average monthly earnings for an active staking node.
| Month | Avg Total Earnings per Node (xBZZ) |
|---|---|
| August | 8.27 |
| September | 17.49 |
| October | 12.22 |
| November | 6.90 |
| December | 4.69 |
| January | 4.10 |
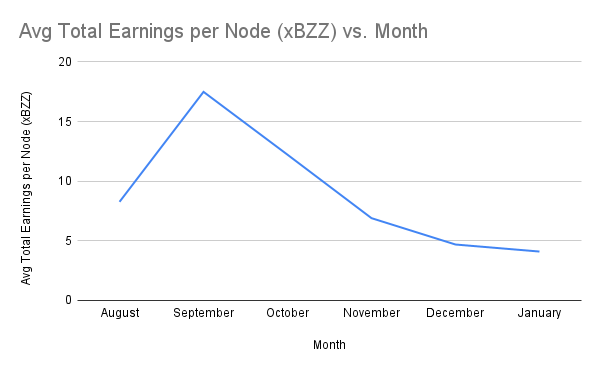
Average monthly earnings per active staking node decreased to 4.10 xBZZ, a 12.6% drop from December’s 4.69 xBZZ. The smaller decline compared to previous months suggests that individual earnings are gradually finding a new equilibrium.
Total Active Staking Nodes by Month
This metric shows the total number of active staking nodes, defined as nodes that have issued at least one commit transaction during the month.
| Month | Total Active Staking Nodes |
|---|---|
| August | 7,506 |
| September | 5,667 |
| October | 7,304 |
| November | 7,830 |
| December | 7,793 |
| January | 7,315 |
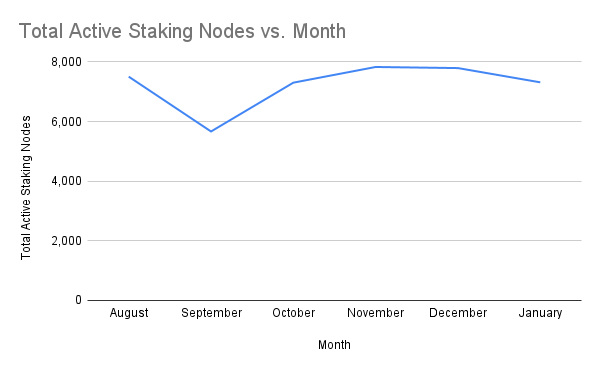
The number of active staking nodes fell to 7,315, a 6.1% decrease from December’s 7,793. Despite this reduction, node participation remains relatively stable, suggesting that a strong core of operators continues to engage with the network.
Total Reachable Full Nodes Regardless of Active Status
This metric counts the total number of unique full nodes (as determined by unique blockchain address) that were reachable at any point in the month, providing a broader picture of network activity beyond just active committers.
| Month | Total Reachable Full Nodes |
|---|---|
| August | 24,168 |
| September | 18,589 |
| October | 15,206 |
| November | 14,075 |
| December | 15,007 |
| January | 12,240 |
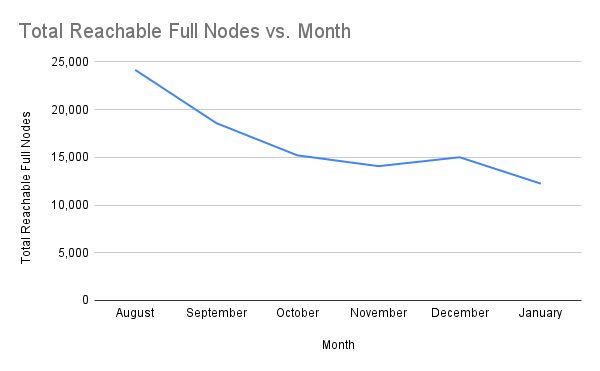
Total reachable full nodes declined to 12,240, an 18.4% drop from December’s 15,007. This marks the largest decrease since August, potentially indicating a shift in operator activity or infrastructure consolidation within the network.
Total Winning Nodes by Month
This metric tracks the number of unique staking nodes that won the redistribution game at least once during the month.
| Month | Total Winning Nodes |
|---|---|
| August | 2,769 |
| September | 2,379 |
| October | 2,588 |
| November | 2,588 |
| December | 2,611 |
| January | 2,547 |
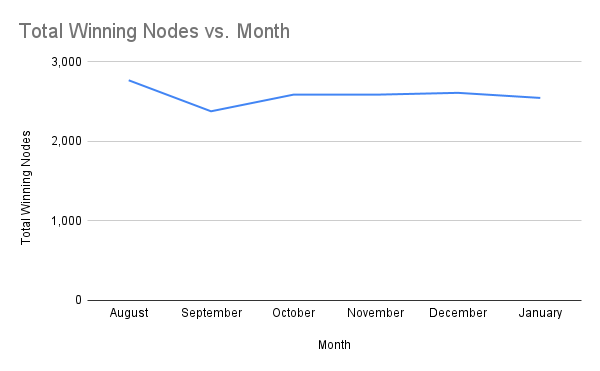
The number of winning nodes declined slightly to 2,547, a 2.4% decrease from December’s 2,611. The relatively small drop suggests that rewards continue to be distributed broadly among participants, reinforcing the decentralized nature of the incentives structure.
Total Active Staking Nodes by Country
This section breaks down active staking nodes by country, providing insights into the global distribution of the network.
| Country | Unique txSenders |
|---|---|
| China | 5554 |
| Finland | 1464 |
| Germany | 234 |
| Spain | 21 |
| The Netherlands | 19 |
| Canada | 5 |
| United States | 4 |
| Hungary | 4 |
| Italy | 2 |
| Mexico | 1 |
| United Kingdom | 1 |
| Switzerland | 1 |
| Russia | 1 |
| Ukraine | 1 |
| France | 1 |
| Japan | 1 |
| India | 1 |
The geographic distribution of nodes remained consistent, with China and Finland leading in node activity. Other regions, such as Germany, Spain, and the Netherlands, maintained steady participation, reinforcing the global nature of the Swarm network.
Conclusion
January 2025 was defined by a trend of stabilization. While there were decreases across several key metrics, the decreases were significantly smaller than in the previous month, suggesting the network is approaching a new equilibrium. While node participation saw a slight dip, the number of active and winning nodes remained relatively stable, indicating continued engagement from node operators despite lower rewards. The Swarm network’s resilience is evident, as many operators continue to contribute to the ecosystem despite shifting rewards.
Discussions about Swarm can be found on Reddit.
All tech support and other channels have moved to Discord!
Please feel free to reach out via info@ethswarm.org
Join the newsletter! .