February 2025 State of the Network Report
With February now complete, network trends indicate continued stabilization. The metrics are largely in line with those of the previous month, suggesting incentive dynamics may be nearing equilibrium.
The number of total reachable full nodes grew, while the number of unique winning nodes declined, indicating increased general network participation combined with a drop in the number of nodes participating in the redistribution game. The geographic distribution of nodes remained stable, with China and Finland leading in activity.
Network Total Monthly Rewards
This metric shows the total storage incentives rewards paid out across the entire network for each month.
| Month | Total Network Rewards (xBZZ) |
|---|---|
| September | 99,124 |
| October | 89,250 |
| November | 54,053 |
| December | 36,521 |
| January | 29,976 |
| February | 27,350 |
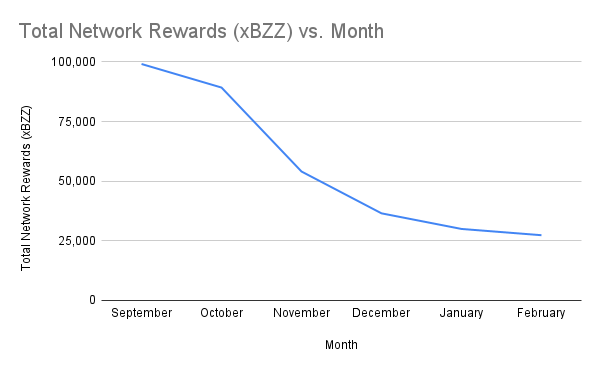
Total network rewards for February stood at 27,350 xBZZ, representing an 8.7% decrease from January’s 29,976 xBZZ. However with 28 days in February and 31 days in January, the average daily rewards are actually higher in February.
Monthly Median Win Values
This metric is the median win amount for each win event, providing insight into the typical reward nodes can expect from a single win event.
| Month | Median Win Values (xBZZ) |
|---|---|
| September | 30.05 |
| October | 27.70 |
| November | 17.44 |
| December | 9.93 |
| January | 8.48 |
| February | 8.54 |
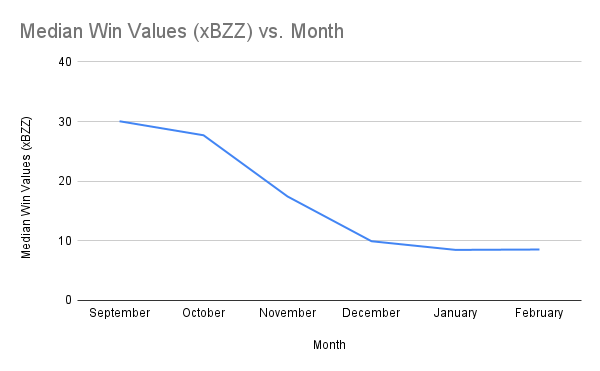
Median win values increased very slightly to 8.54 xBZZ, up 0.7% from January’s 8.48 xBZZ. This minor uptick indicates that the rewards per win event have stabilized, reducing the month-over-month volatility observed in previous months.
Monthly Average Win Values
This metric shows the average win amount for each win event, offering an understanding of how the reward amounts are distributed across the network.
| Month | Average Win Values (xBZZ) |
|---|---|
| September | 32.58 |
| October | 28.07 |
| November | 17.13 |
| December | 11.15 |
| January | 9.13 |
| February | 9.39 |
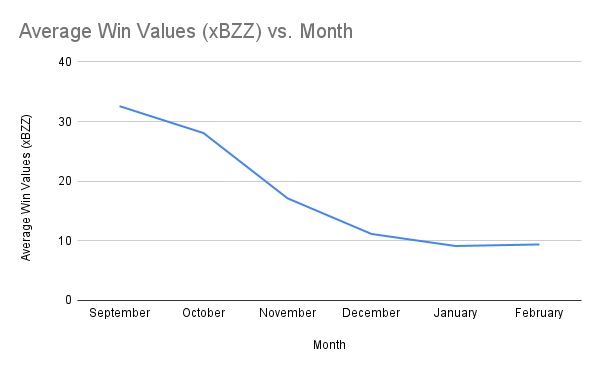
Average win values rose to 9.39 xBZZ, marking a 2.8% increase from January’s 9.13 xBZZ. This increase, while modest, indicates that winning nodes may be receiving slightly higher rewards per event compared to the previous month.
Active Staking Node Monthly Average Earnings
This metric shows the average monthly earnings for an active staking node, with an “active node” defined as a node that has submitted at least one commit transaction during the month.
| Month | Avg Total Earnings per Node (xBZZ) |
|---|---|
| September | 17.49 |
| October | 12.22 |
| November | 6.90 |
| December | 4.69 |
| January | 4.10 |
| February | 4.19 |
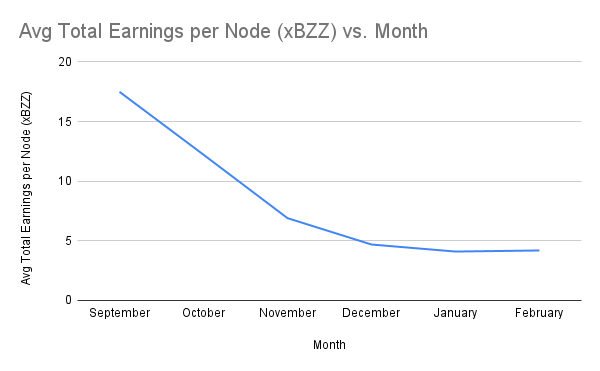
The average earnings per active staking node increased to 4.19 xBZZ, a 2.2% rise from January’s 4.10 xBZZ. This minor increase further indicates a stabilization in trends compared with the volatility of previous months.
Total Active Staking Nodes by Month
This metric shows the total number of active staking nodes, defined as nodes that have issued at least one commit transaction during the month.
| Month | Total Active Staking Nodes |
|---|---|
| September | 5,667 |
| October | 7,304 |
| November | 7,830 |
| December | 7,793 |
| January | 7,315 |
| February | 6,532 |
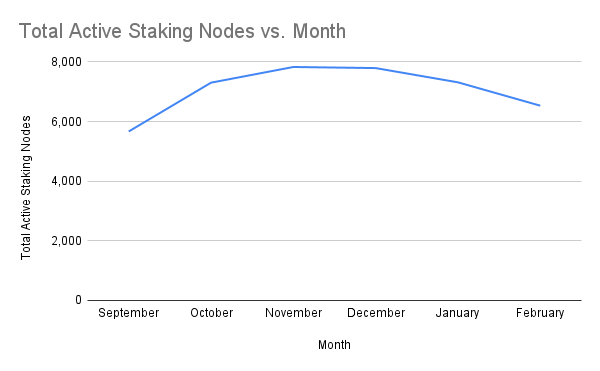
The number of active staking nodes declined to 6,532, a 10.7% decrease from January’s 7,315. This reduction may reflect an adjustment period as some node operators exit the network.
Total Reachable Full Nodes Regardless of Active Status
This metric counts the total number of unique full nodes (as determined by unique blockchain address) that were reachable at any point in the month, providing a broader picture of network activity beyond just active committers.
| Month | Total Reachable Full Nodes |
|---|---|
| September | 18,589 |
| October | 15,206 |
| November | 14,075 |
| December | 15,007 |
| January | 12,240 |
| February | 12,858 |
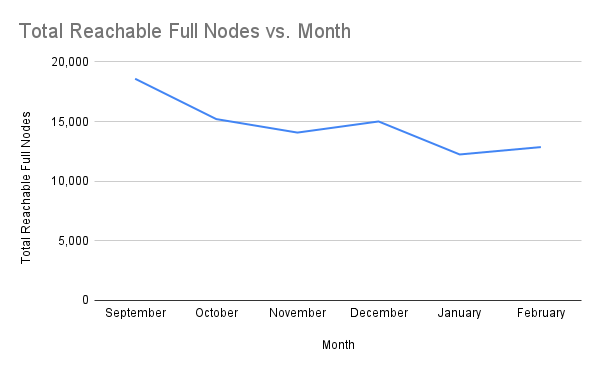
Total reachable full nodes increased to 12,858, marking a 5.1% increase from January’s 12,240. This growth may suggest renewed interest in network participation or improved node uptime and connectivity. When viewed alongside the drop in total active staking nodes, it suggests an increase in altruistic full node operators who are sharing their disk space without participating in the storage incentives system.
Total Winning Nodes by Month
This metric tracks the number of unique staking nodes that won the redistribution game at least once during the month.
| Month | Total Winning Nodes |
|---|---|
| September | 2,379 |
| October | 2,588 |
| November | 2,588 |
| December | 2,611 |
| January | 2,547 |
| February | 2,203 |
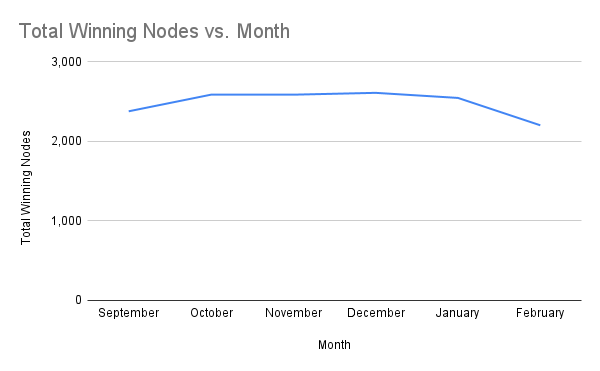
The number of winning nodes declined to 2,203, down 13.5% from January’s 2,547. This decrease aligns with the overall reduction in active staking nodes.
Total Active Staking Nodes by Country
This section breaks down active staking nodes by country, providing insights into the global distribution of the network.
| Country | Unique txSenders |
|---|---|
| China | 4691 |
| Finland | 1566 |
| Germany | 235 |
| The Netherlands | 12 |
| Canada | 7 |
| Hungary | 5 |
| Spain | 5 |
| United States | 3 |
| France | 2 |
| Switzerland | 1 |
| Slovenia | 1 |
| Norway | 1 |
| Estonia | 1 |
| Italy | 1 |
| Japan | 1 |
The geographic distribution of active nodes remained largely stable, with China and Finland continuing to dominate participation. While China saw a slight decrease in active nodes, Finland’s presence grew marginally.
Conclusion
February’s metrics indicate that the network is stabilizing after months of volatility. While total rewards and active nodes declined slightly, the rate of change across all metrics has slowed, and key indicators such as median and average win values saw modest increases. These signs suggest the network is approaching equilibrium, potentially leading to a more predictable environment going forward.
Discussions about Swarm can be found on Reddit.
All tech support and other channels have moved to Discord!
Please feel free to reach out via info@ethswarm.org
Join the newsletter! .