April saw a decline in xBZZ-denominated rewards, however it must be understood in light of the increase in the fiat price of xBZZ over the month. Although rewards in xBZZ decreased, the real-world value distributed to node operators may have remained steady and likely increased for many.
April 2025 State of the Network Report
Network Total Monthly Rewards
This metric shows the total storage incentives rewards paid out across the entire network for each month.
| Month | Total Network Rewards (xBZZ) |
|---|---|
| November | 54,053 |
| December | 36,521 |
| January | 29,976 |
| February | 27,350 |
| March | 39,853 |
| April | 24,441 |
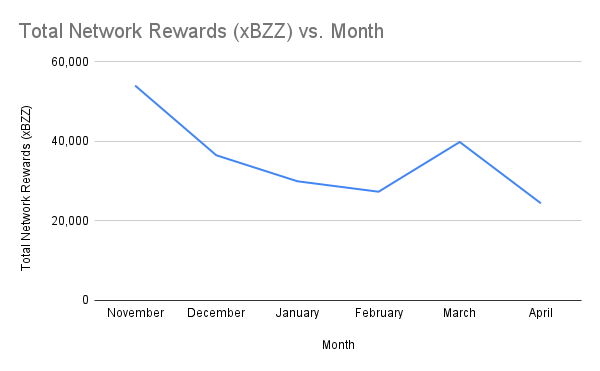
Total network rewards dropped to 24,441 xBZZ in April, down 38.7% from March’s 39,853 xBZZ. This is the lowest monthly total since February.
Monthly Median Win Values
This metric is the median win amount for each win event, providing insight into the typical reward nodes can expect from a single win event.
| Month | Median Win Values (xBZZ) |
|---|---|
| November | 17.44 |
| December | 9.93 |
| January | 8.48 |
| February | 8.54 |
| March | 11.73 |
| April | 7.21 |
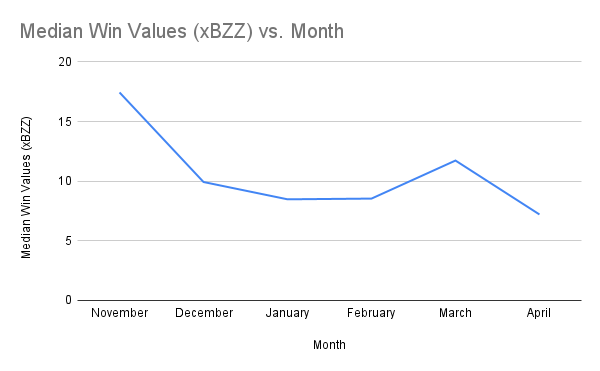
Median win values declined to 7.21 xBZZ, down from 11.73 xBZZ in March—a 38.6% reduction.
Monthly Average Win Values
This metric shows the average win amount for each win event, offering an understanding of how the reward amounts are distributed across the network.
| Month | Average Win Values (xBZZ) |
|---|---|
| November | 17.13 |
| December | 11.15 |
| January | 9.13 |
| February | 9.39 |
| March | 12.21 |
| April | 7.51 |
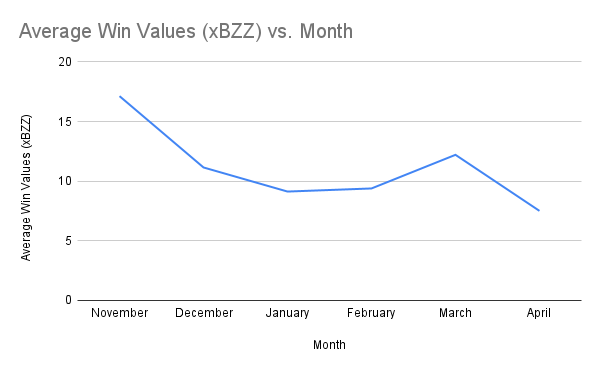
Average win values fell to 7.51 xBZZ from 12.21 xBZZ in March, a 38.5% decrease.
Active Staking Node Monthly Average Earnings
This metric shows the average monthly earnings for an active staking node, with an “active node” defined as a node that has submitted at least one commit transaction during the month.
| Month | Avg Total Earnings per Node (xBZZ) |
|---|---|
| November | 6.90 |
| December | 4.69 |
| January | 4.10 |
| February | 4.19 |
| March | 7.02 |
| April | 4.88 |
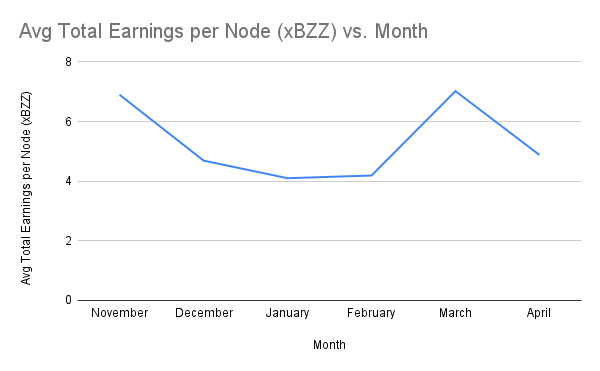
Average earnings per active staking node fell to 4.88 xBZZ in April, down from 7.02 xBZZ in March — a 31.6% decline. However, when considered alongside the nearly 100% increase in the fiat price of BZZ, the actual economic impact may have been neutral or even likely positive for many node operators.
Total Active Staking Nodes by Month
This metric shows the total number of active staking nodes, defined as full nodes that have issued at least one commit transaction during the month.
| Month | Total Active Staking Nodes |
|---|---|
| November | 7,830 |
| December | 7,793 |
| January | 7,315 |
| February | 6,532 |
| March | 5,676 |
| April | 5,008 |
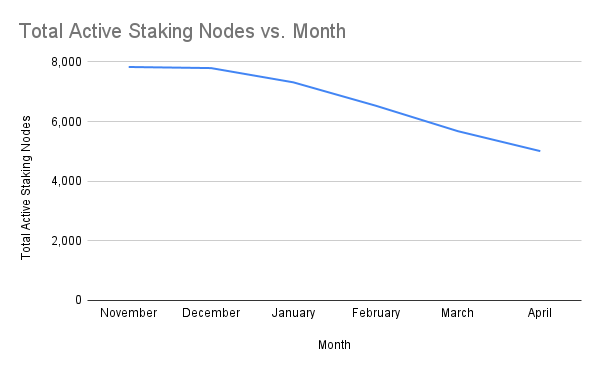
The number of active staking nodes dropped to 5,008 in April, an 11.8% decline from March.
Total Reachable Full Nodes Regardless of Active Status
This metric counts the total number of unique full nodes (as determined by unique blockchain address) that were reachable at any point in the month, providing a broader picture of network activity beyond just active committers.
| Month | Total Reachable Full Nodes |
|---|---|
| November | 14,075 |
| December | 15,007 |
| January | 12,240 |
| February | 12,858 |
| March | 13,481 |
| April | 12,054 |
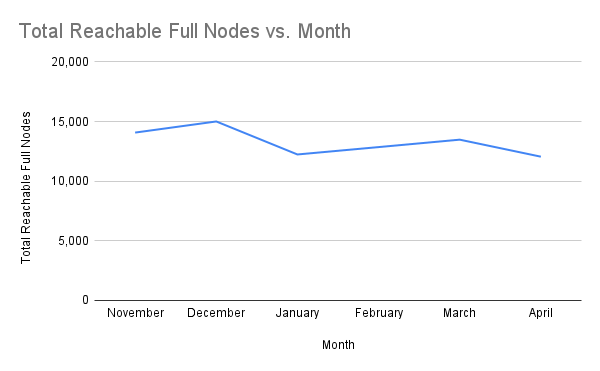
Reachable full nodes saw a moderate decrease of 10.6%, from 13,481 in March to 12,054 in April.
Total Winning Nodes by Month
This metric tracks the number of unique staking nodes that won the redistribution game at least once during the month.
| Month | Total Winning Nodes |
|---|---|
| November | 2,588 |
| December | 2,611 |
| January | 2,547 |
| February | 2,203 |
| March | 2,253 |
| April | 2,197 |
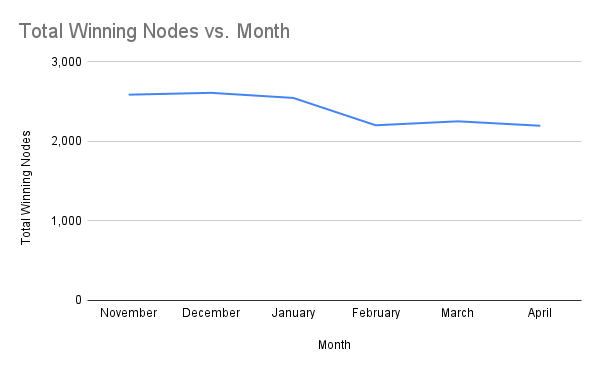
The number of winning nodes fell very slightly to 2,197 from 2,253 in March, only a 2.5% decrease.
Total Active Staking Nodes by Country
This metric shows the total number of active staking nodes globally for the month of April, 2025.
| Country | Unique txSenders |
|---|---|
| Finland | 2494 |
| China | 1923 |
| Germany | 513 |
| Canada | 14 |
| Unknown | 13 |
| United States | 5 |
| Hungary | 4 |
| Spain | 3 |
| South Korea | 3 |
| Philippines | 3 |
| Russia | 3 |
| Estonia | 3 |
| Bangladesh | 2 |
| Brazil | 2 |
| Indonesia | 2 |
| Japan | 2 |
| Slovenia | 2 |
| Ukraine | 2 |
| France | 2 |
| United Kingdom | 2 |
| Thailand | 1 |
| Mexico | 1 |
| Vietnam | 1 |
| Romania | 1 |
| The Netherlands | 1 |
| Greece | 1 |
| Belarus | 1 |
| Oman | 1 |
| Pakistan | 1 |
| Switzerland | 1 |
| Norway | 1 |
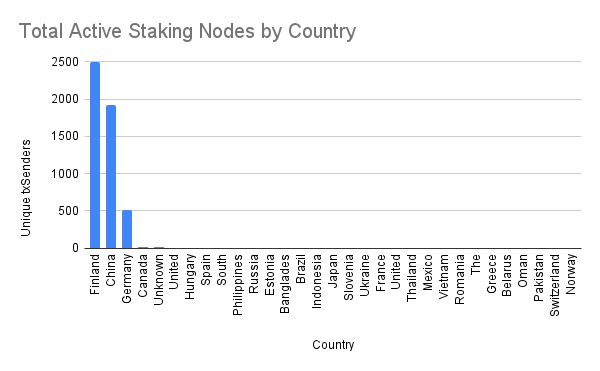
The country-level distribution of active staking nodes remains largely unchanged. Finland and China continue to account for the majority of the network, with Germany a distant third. Minor movements in lower-ranked countries had no meaningful effect on the overall landscape.
Conclusion
April saw a broad decline in BZZ-denominated rewards across all metrics, including total rewards, win values, and average earnings per node. However, this trend must be understood in the context of a nearly 100% increase in the fiat price of BZZ, which may have offset or even reversed the apparent drop in value for node operators. There were also some decreases in the number of active and reachable nodes, but the overall global participation has not changed significantly.
Discussions about Swarm can be found on Reddit.
All tech support and other channels have moved to Discord!
Please feel free to reach out via info@ethswarm.org
Join the newsletter! .