In this report, we analyze the Swarm network’s performance for September 2024, focusing on various key metrics such as total rewards, win values, node earnings, and geographic distribution. These metrics help track the evolving landscape of the Swarm network as it progresses month by month.
Network Total Monthly Rewards
This metric shows the total xBZZ rewards distributed across the entire network for each month.
| Month | Total Network Rewards (xBZZ) |
|---|---|
| April | 76,024 |
| May | 109,209 |
| June | 112,037 |
| July | 105,855 |
| August | 62,093 |
| September | 99,124 |
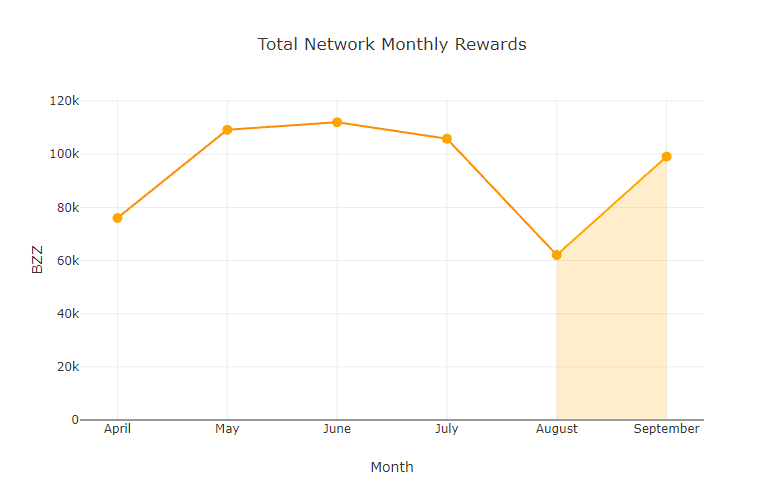
In September, the total network rewards increased to 99,124 xBZZ from August’s low of 62,093 xBZZ. This rise shows a recovery in reward distribution following August’s dip.
Monthly Median Win Values
This metric tracks the median value of win events, indicating the most typical reward size that nodes can expect to earn in a single win event.
| Month | Median Win Values (xBZZ) |
|---|---|
| April | 22.27 |
| May | 32.65 |
| June | 33.92 |
| July | 33.67 |
| August | 12.48 |
| September | 30.05 |
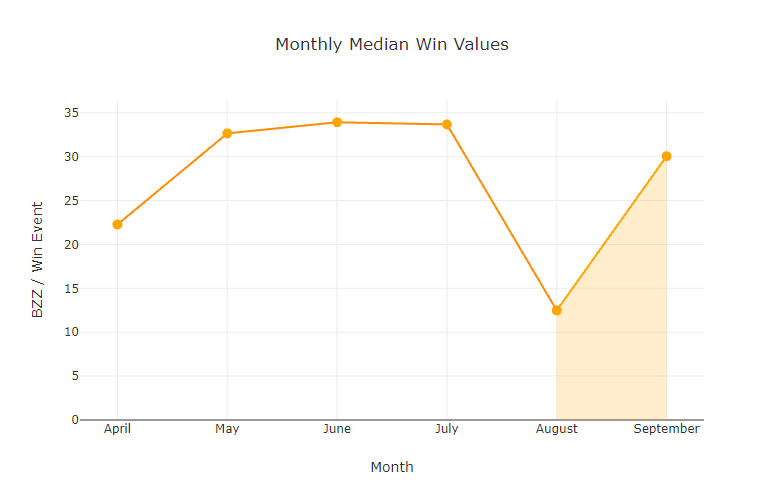
The median win values in September rebounded to 30.05 xBZZ after falling to 12.48 xBZZ in August, bringing values closer to earlier months.
Monthly Average Win Values
This metric is the average win amount for each win event.
| Month | Average Win Values (xBZZ) |
|---|---|
| April | 25.43 |
| May | 36.56 |
| June | 37.07 |
| July | 36.05 |
| August | 19.44 |
| September | 32.58 |
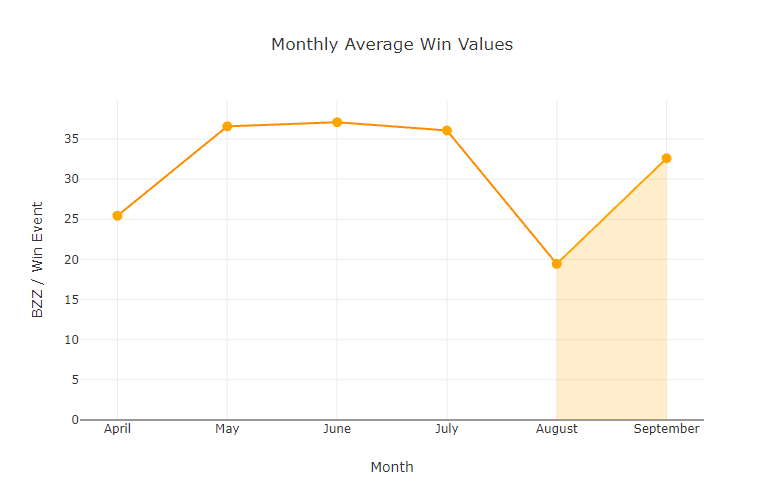
September saw a significant increase in average win values, climbing from 19.44 xBZZ in August to 32.58 xBZZ.
Active Staking Node Monthly Average Earnings
This section shows the average earnings per active staking node, offering insight into how much each active participant in the network earned (with an “active node” defined as a node which has submitted a commit transaction at least once in the month).
| Month | Avg Total Earnings per Node (xBZZ) |
|---|---|
| April | 5.64 |
| May | 10.66 |
| June | 9.37 |
| July | 8.22 |
| August | 8.27 |
| September | 17.49 |
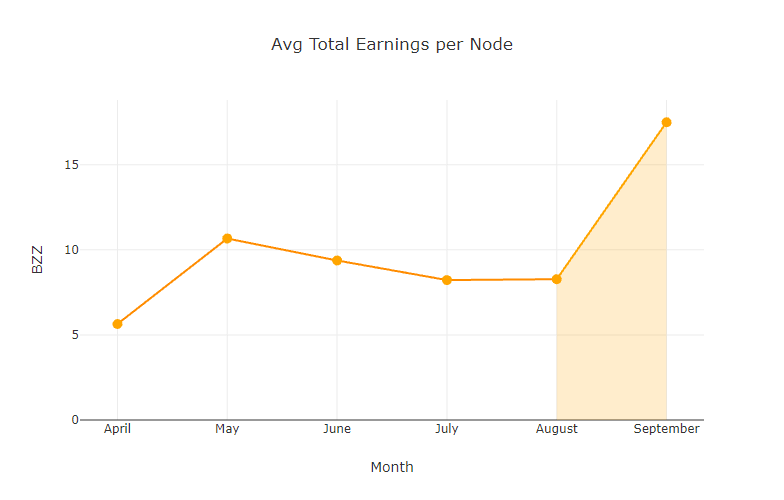
Average earnings per active node saw a sharp increase in September, rising to 17.49 xBZZ. This is the highest value observed in recent months, and is likely as a result of the increase in total network rewards combined with a smaller number of active staking nodes.
Total Active Staking Nodes by Month
This metric shows the total number of active staking nodes, with “active node” defined as a node that submitted at least one commit transaction during the month.
| Month | Total Active Staking Nodes |
|---|---|
| April | 13,486 |
| May | 10,245 |
| June | 11,950 |
| July | 12,871 |
| August | 7,506 |
| September | 5,667 |
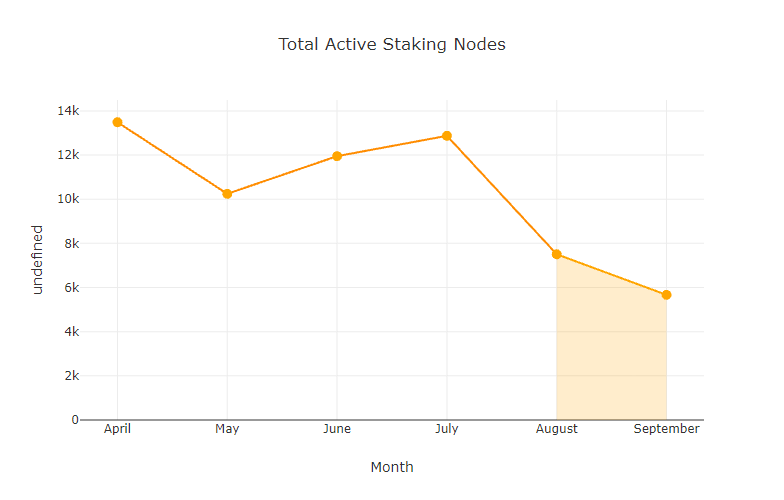
September saw a continued decline in the number of active staking nodes, dropping to 5,667 from August’s 7,506.
Total Reachable Full Nodes Regardless of Active Status
This metric counts the total number of unique full nodes which were reachable at any point in the month, offering a broader view of node activity beyond just active committers.
| Month | Total Reachable Full Nodes |
|---|---|
| May | 16,000 |
| June | 18,916 |
| July | 20,898 |
| August | 24,168 |
| September | 18,589 |
The number of reachable full nodes declined in September, falling to 18,589 from August’s peak of 24,168.
Total Winning Nodes by Month
This section tracks how many unique staking nodes won the redistribution game at least once during the month.
| Month | Total Winning Nodes |
|---|---|
| April | 2,486 |
| May | 2,554 |
| June | 2,680 |
| July | 2,622 |
| August | 2,769 |
| September | 2,379 |
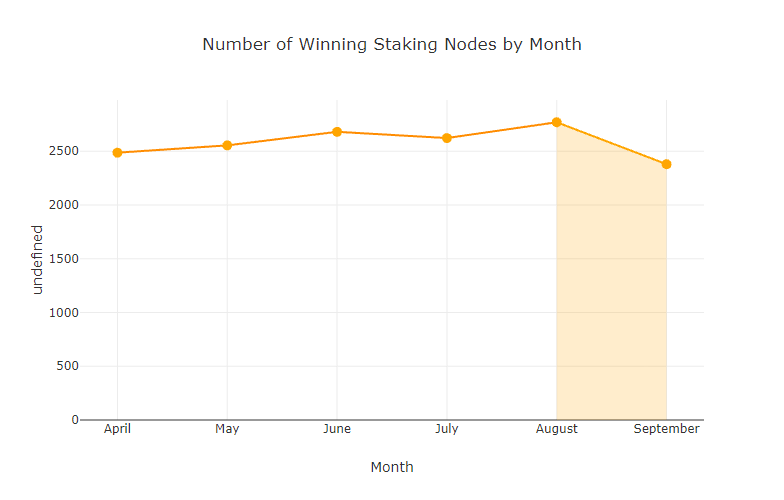
The number of winning nodes decreased in September, dropping to 2,379 from August’s 2,769. This reduction aligns with the lower number of active nodes this month.
Total Active Staking Nodes by Country
This section provides a breakdown of active staking nodes by country, showing the geographic distribution of network participants.
| China | Germany | Finland | Unknown | United States | Other | |
|---|---|---|---|---|---|---|
| April | 7,249 | 1,912 | 2,291 | 1,851 | 92 | 91 |
| May | 6,010 | 1,739 | 2,173 | 1,899 | 84 | 69 |
| June | 7,480 | 1,718 | 2,276 | 370 | 79 | 27 |
| July | 8,539 | 1,828 | 2,395 | 1 | 83 | 25 |
| August | 5,406 | 886 | 1,157 | 1 | 40 | 16 |
| September | 3,440 | 655 | 1,503 | 3 | N/A | 66 |
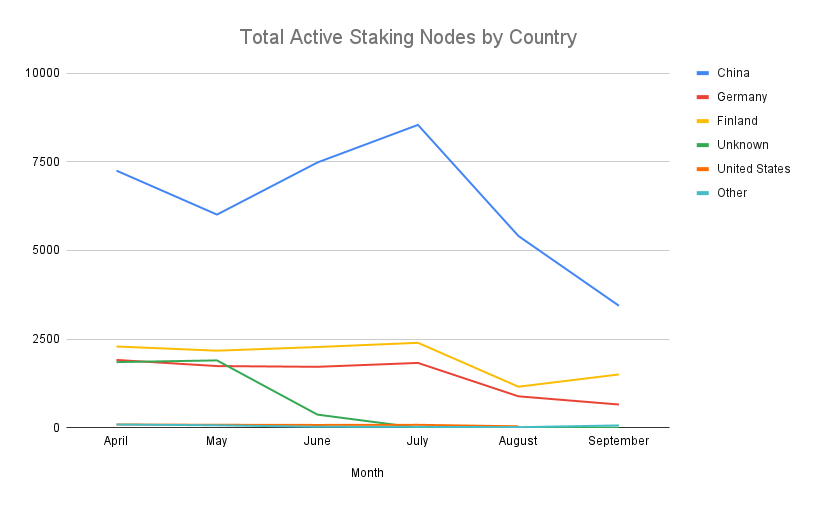
In September, China continues to dominate the network in terms of node count, though numbers have decreased since August. Other countries, including Germany and Finland, maintained their positions while the United States dropped out of the top categories, and Spain and the Netherlands saw increases (which are aggregated in the “Other” category).
Conclusion
In September 2024, the Swarm network saw some dramatic shifts in node participation and node earnings, with rewards and average node earnings rebounding along with a significant reduction in active node participation. The decrease in active staking nodes along with the increase in average earnings per node are a sign of the Swarm network’s self adjusting economic incentives mechanism working as expected.
Discussions about Swarm can be found on Reddit.
All tech support and other channels have moved to Discord!
Please feel free to reach out via info@ethswarm.org
Join the newsletter! .