In this report, we analyze the Swarm network’s performance for November 2024. By examining key metrics such as total rewards, win values, average node earnings, and geographic distribution, we gain insights into the network’s trends and dynamics.
Network Total Monthly Rewards
This metric shows the total rewards paid out across the entire network for each month.
| Month | Total Network Rewards (xBZZ) |
|---|---|
| June | 112,037 |
| July | 105,855 |
| August | 62,093 |
| September | 99,124 |
| October | 89,250 |
| November | 54,053 |
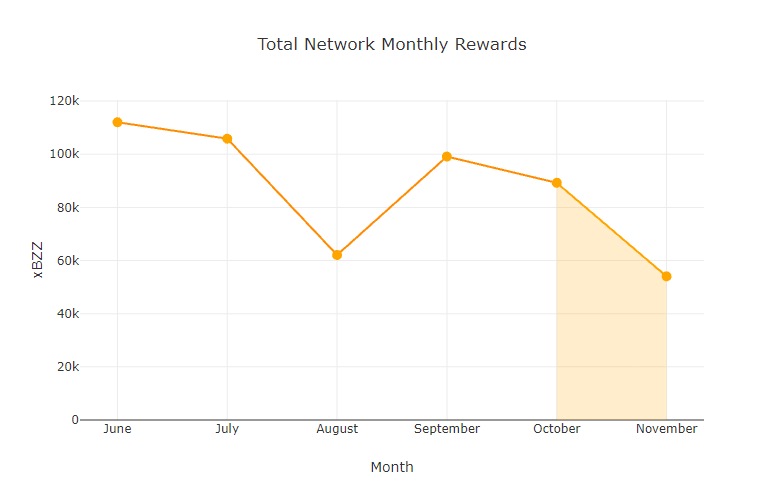
November saw a decline in total network rewards to 54,053 xBZZ, representing a significant drop from October. This decline aligns with a broader reduction in win values and earnings across the network.
Monthly Median Win Values
This metric is the median win amount for each win event, providing insight into the typical reward nodes can expect from a single win event.
| Month | Median Win Values (xBZZ) |
|---|---|
| June | 33.92 |
| July | 33.67 |
| August | 12.48 |
| September | 30.05 |
| October | 27.70 |
| November | 17.44 |
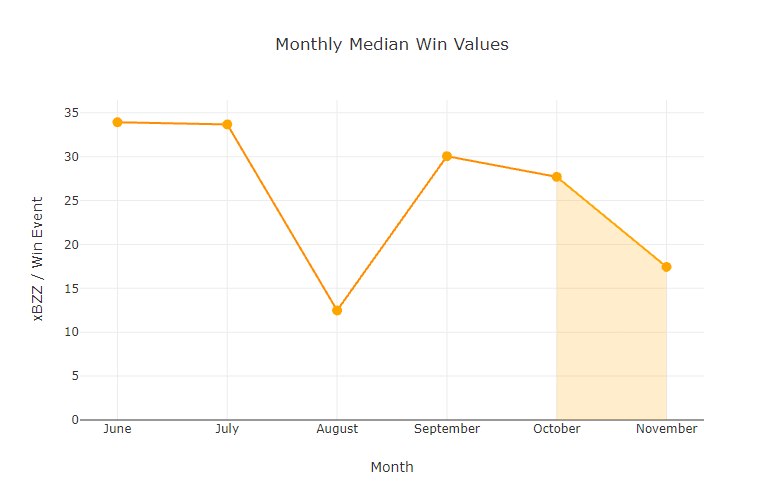
The median win value for November was 17.44 xBZZ, a significant decrease from October’s 27.70 xBZZ. This indicates lower typical rewards per win event compared to previous months.
Monthly Average Win Values
This metric shows the average win amount for each win event, offering an understanding of how the reward amounts are distributed across the network.
| Month | Average Win Values (xBZZ) |
|---|---|
| June | 37.07 |
| July | 36.05 |
| August | 19.44 |
| September | 32.58 |
| October | 28.07 |
| November | 17.13 |
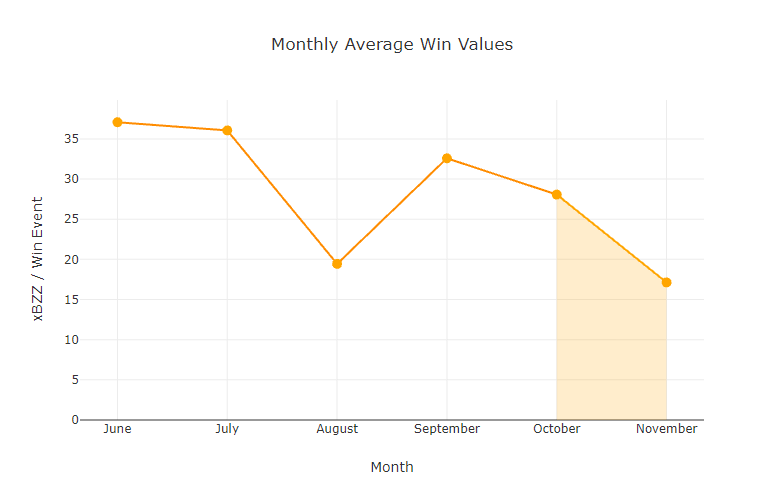
The average win value dropped to 17.13 xBZZ in November, reflecting a significant reduction in the distribution of rewards per win event.
Active Staking Node Monthly Average Earnings
This metric shows the average monthly earnings for an active staking node, with an “active node” defined as a node that has submitted at least one commit transaction during the month.
| Month | Avg Total Earnings per Node (xBZZ) |
|---|---|
| June | 9.37 |
| July | 8.22 |
| August | 8.27 |
| September | 17.49 |
| October | 12.17 |
| November | 6.90 |
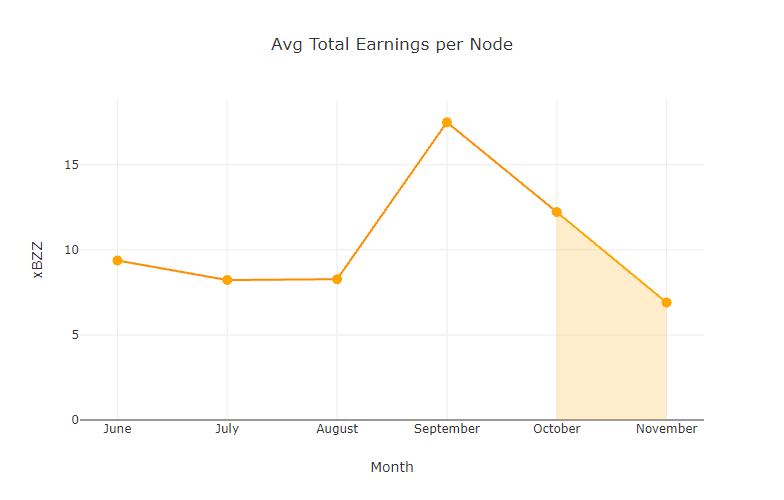
The average earnings per active staking node fell to 6.90 xBZZ in November, reflecting the impact of reduced total network rewards combined with a slight increase in the number of active staking nodes.
Total Active Staking Nodes by Month
This metric shows the total number of active staking nodes, defined as nodes that have issued at least one commit transaction during the month.
| Month | Total Active Staking Nodes |
|---|---|
| June | 11,950 |
| July | 12,871 |
| August | 7,506 |
| September | 5,667 |
| October | 7,331 |
| November | 7,830 |
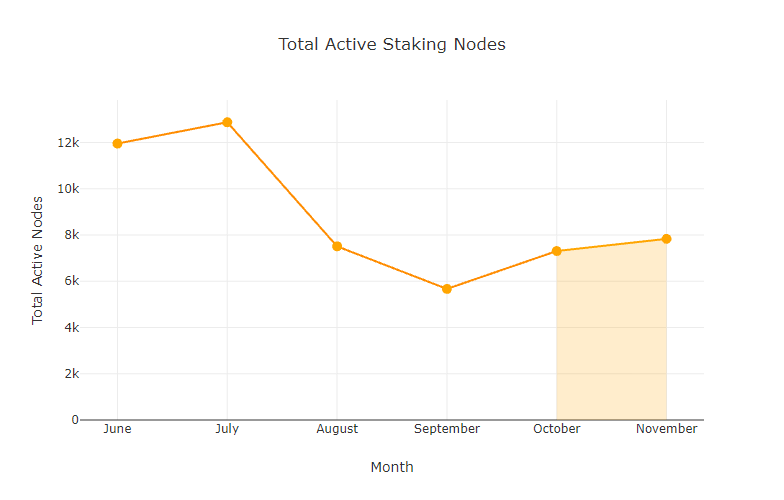
November saw a slight increase in active staking nodes to 7,830, continuing the recovery trend from September’s low participation levels.
Total Reachable Full Nodes Regardless of Active Status
This metric counts the total number of unique full nodes that were reachable at any point in the month, providing a broader picture of network activity beyond just active committers.
| Month | Total Reachable Full Nodes |
|---|---|
| June | 18,916 |
| July | 20,898 |
| August | 24,168 |
| September | 18,589 |
| October | 15,206 |
| November | 14,075 |
The number of reachable full nodes decreased further in November to 14,075, continuing the downward trend seen since August.
Total Winning Nodes by Month
This metric tracks the number of unique staking nodes that won the redistribution game at least once during the month.
| Month | Total Winning Nodes |
|---|---|
| June | 2,680 |
| July | 2,622 |
| August | 2,769 |
| September | 2,379 |
| October | 2,588 |
| November | 2,588 |
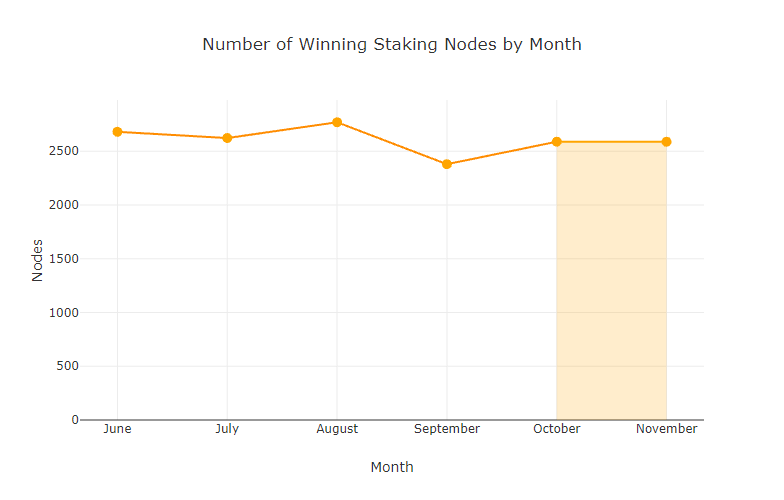
The total number of winning nodes remained stable at 2,588 in November, showing no change from October (note that while the number of winning nodes is coincidently the same, the total number of win events and the set of winning nodes both differ from the previous month).
Total Active Staking Nodes by Country
This section breaks down active staking nodes by country, providing insights into the global distribution of the network.
| Country | October | November |
|---|---|---|
| China | 4,819 | 5,492 |
| Finland | 1,688 | 1,802 |
| Germany | 736 | 462 |
| Spain | 26 | 21 |
| The Netherlands | 15 | 18 |
| United States | 13 | 10 |
| Italy | 3 | 3 |
| Vietnam | 1 | 2 |
| Unknown | 10 | 10 |
| Belarus | 1 | 1 |
| India | 4 | 3 |
| Thailand | 1 | 1 |
| Estonia | 3 | 2 |
| Lithuania | 1 | 1 |
| Singapore | 1 | 1 |
| Hungary | 2 | 1 |
| Slovenia | 1 | 0 |
| Russia | 3 | 0 |
| Switzerland | 2 | 0 |
| France | 1 | 0 |
| Denmark | 0 | 0 |
| Japan | 0 | 0 |
November saw a small to moderate rebalancing of the geographic distribution of nodes, with the general pattern of distribution remaining unchanged. China continued to lead the network with a modest increase in active nodes up to 5,492. Finland’s node count rose to 1,802, while Germany saw a decline, dropping to 462. A handful of nodes were also observed across a number of countries, primarily in Europe and Asia.
Conclusion
November 2024 saw a decline in the Swarm network’s reward levels, with reductions in total rewards and average node earnings continuing a downward trend. Despite these economic pressures, the number of active staking nodes increased slightly to 7,830, reflecting a steady level of participation. This suggests that operators remain engaged with the network, even as reward dynamics shift.
Discussions about Swarm can be found on Reddit.
All tech support and other channels have moved to Discord!
Please feel free to reach out via info@ethswarm.org
Join the newsletter! .
