In the March edition of our “State of the Network” series, we provide an in-depth look at the Swarm network’s metrics and the notable changes they have undergone. This month’s report captures a dynamic period for the network, characterized by variations in rewards and geographical distribution of nodes. Through this analysis, stakeholders can gain insights into the evolving landscape of the Swarm network.
Network Total Monthly Rewards
This metric shows the total rewards paid out across the entire network for each month.
| Month | Total Network Rewards (xBZZ) |
|---|---|
| October | 152,868 |
| November | 148,617 |
| December | 159,865 |
| January | 157,596 |
| February | 152,974 |
| March | 104,657 |
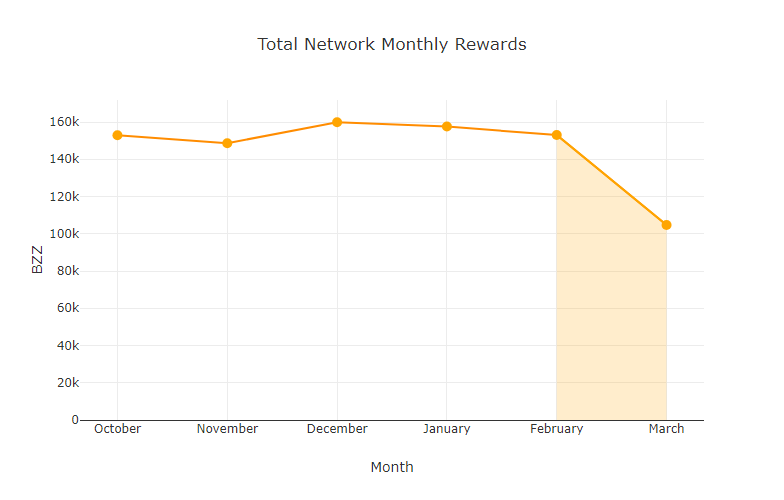
In March, total network rewards saw a notable decrease to 104,657 xBZZ, marking the lowest payout in the recent months, underscoring a change in network utilisation.
Monthly Median Win Values
This metric is the median win amount for each win event.
| Month | Median Win Values (xBZZ) |
|---|---|
| October | 46.84 |
| November | 46.83 |
| December | 48.06 |
| January | 47.43 |
| February | 49.15 |
| March | 27.43 |
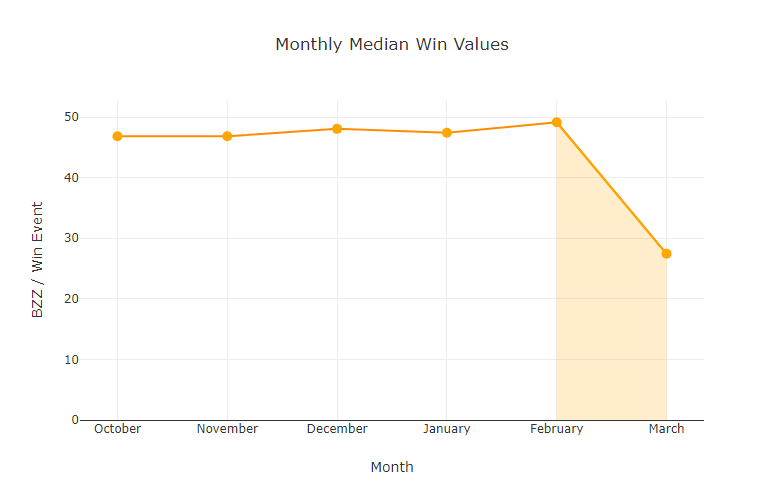
The median win values experienced a marked decline to 27.43 xBZZ, reflecting a decrease in the typical reward amount won by nodes in win events.
Monthly Average Win Values
This metric is the average win amount for each win event.
| Month | Average Win Values (xBZZ) |
|---|---|
| October | 62.09 |
| November | 47.41 |
| December | 57.75 |
| January | 51.20 |
| February | 54.42 |
| March | 34.96 |
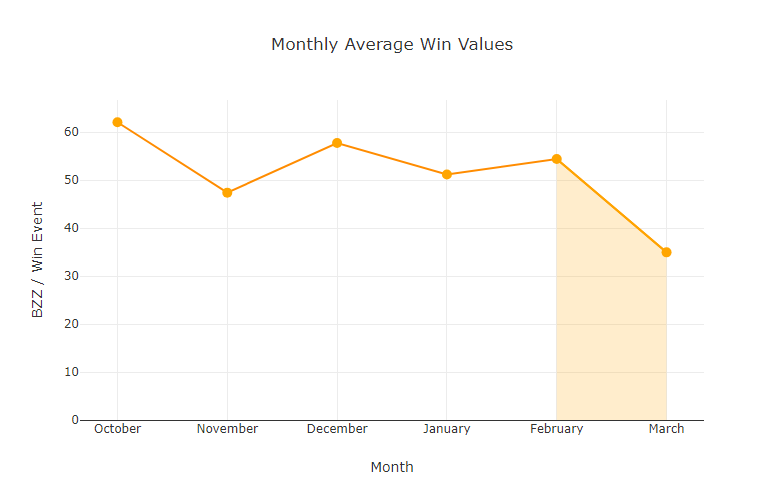
Average win values also saw a reduction, settling at 34.96 xBZZ, indicating a lower average reward amount collected per win across the network.
Active Staking Node Monthly Average Earnings
This metric shows the average monthly earnings for an active staking node (defined as a node which has submitted a commit transaction at least once in the month).
| Month | Avg Total Earnings per Node (xBZZ) |
|---|---|
| October | 14.73 |
| November | 8.12 |
| December | 12.40 |
| January | 13.89 |
| February | 13.21 |
| March | 7.71 |
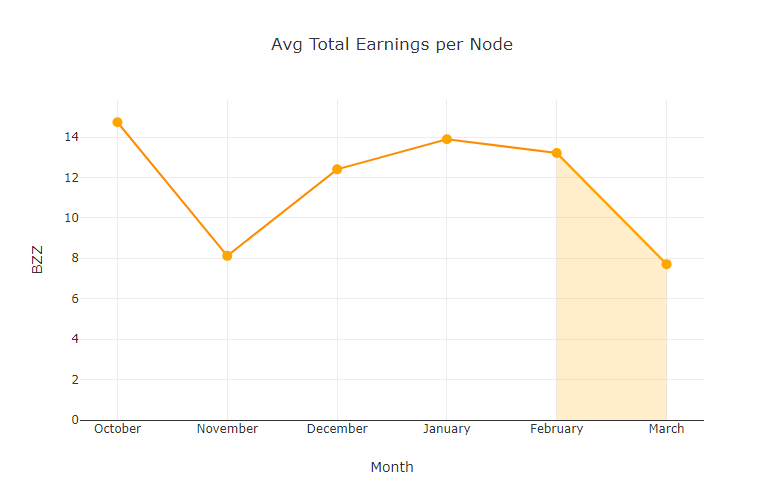
In line with the trend for other metrics, the average monthly earnings for an active staking node decreased significantly to 7.711 xBZZ in March, reflecting a downturn in earnings across active nodes.
Total Active Staking Nodes by Month
This metric shows the total active staking nodes by month (again, defined as a node which has submitted a commit transaction at least once in the month).
| Month | Total Active Staking Nodes |
|---|---|
| October | 10,367 |
| November | 20,868 |
| December | 12,891 |
| January | 11,350 |
| February | 11,576 |
| March | 13,571 |
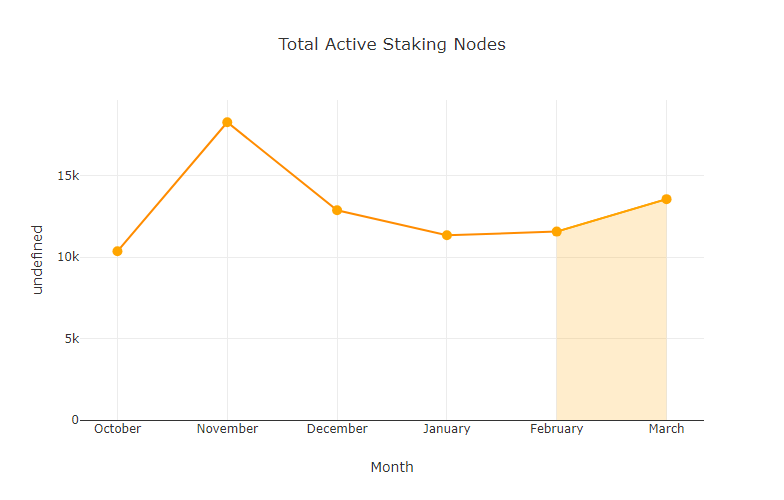
March recorded an increase in the total number of active staking nodes to 13,571, showing a rebound in network participation compared to the previous month.
Total Winning Nodes by Month
This metric shows the total number of unique active staking nodes which have won at least once within the month.
| Month | Total Winning Nodes |
|---|---|
| October | 2,462 |
| November | 2,787 |
| December | 2,308 |
| January | 2,474 |
| February | 2,814 |
| March | 2,413 |
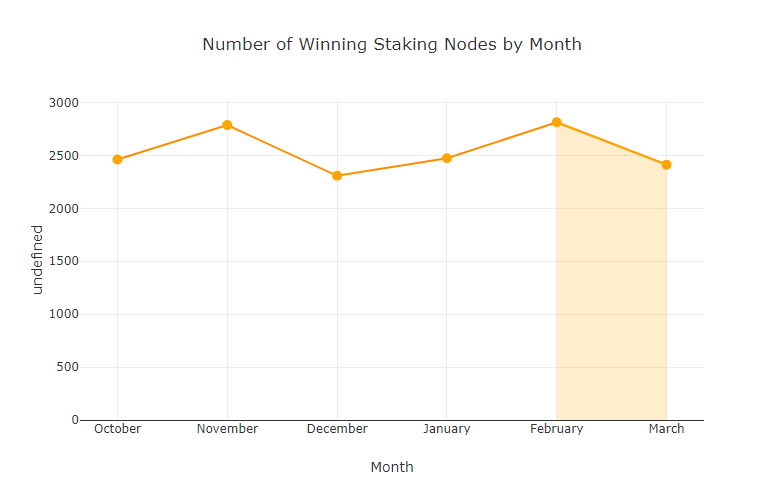
The total number of unique winning nodes slightly decreased to 2,413, indicating a small shift in the composition of winning participants within the network.
Total Active Staking Nodes by Country
This metric shows the total number of active staking nodes across the top four countries and all other countries aggregated into the “Other” category, as well as the remaining nodes in the “Unknown” category.
| China | Germany | Finland | Unknown | United States | Other | |
|---|---|---|---|---|---|---|
| October | 6,242 | 2,042 | 1,543 | 175 | 282 | 91 |
| November | 16,145 | 2,225 | 1,961 | 37 | 363 | 137 |
| December | 8,333 | 2,001 | 1,919 | 265 | 312 | 61 |
| January | 6,696 | 1,937 | 1,769 | 701 | 181 | 66 |
| February | 6,787 | 1,958 | 1,952 | 688 | 116 | 75 |
| March | 7,785 | 1,953 | 2,232 | 1,408 | 91 | 102 |
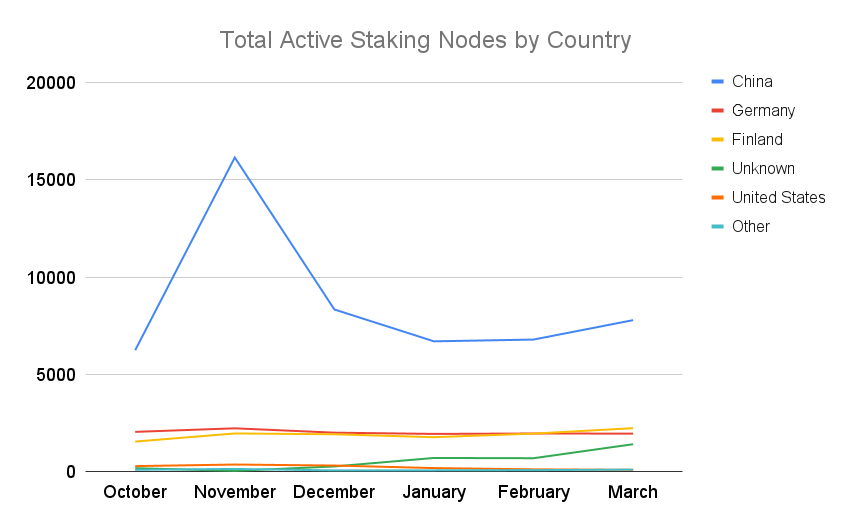
The geographic distribution of active staking nodes in March showed notable changes, with increases in nodes from China, Finland, and “Other” countries, while the “Unknown” category saw a substantial increase.
Conclusion
The March report reveals a complex picture of adjustment within the Swarm network, highlighted by a decrease in total rewards but an increase in active staking nodes. This suggests a period of rebalancing and diversification in network participation and reward distribution. The geographical spread of nodes underscores the network’s evolving global reach. As we continue to monitor these trends, the evolving dynamics of the Swarm network offer valuable insights into its resilience and adaptability in light of changing conditions.
Discussions about Swarm can be found on Reddit.
All tech support and other channels have moved to Discord!
Please feel free to reach out via info@ethswarm.org
Join the newsletter! .