Introduction
This report provides a detailed analysis of various Swarm network metrics for June 2024, focusing on redistribution-related data. These metrics offer insights into total rewards, win values, earnings, node activity, and geographic distribution, helping to understand trends and performance variations over time.
Network Total Monthly Rewards
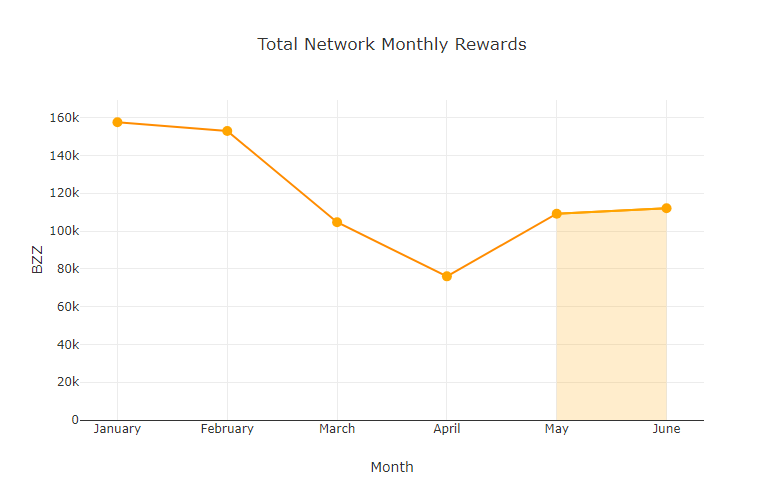
This metric shows the total rewards paid out across the entire network for each month.
| Month | Total Network Rewards (xBZZ) |
|---|---|
| January | 157,596 |
| February | 152,974 |
| March | 104,657 |
| April | 76,024 |
| May | 109,209 |
| June | 112,037 |
Analysis
Total network rewards showed a moderate increase in June over the previous month from 109,209 xBZZ to 112,037 xBZZ, continuing the upward trend from May.
Monthly Median Win Values
This metric is the median win amount for each win event.
| Month | Median Win Values (xBZZ) |
|---|---|
| January | 47.43 |
| February | 49.15 |
| March | 27.43 |
| April | 22.27 |
| May | 32.65 |
| June | 33.92 |

Analysis
June saw a slight increase in the median win value from 32.65 xBZZ to 33.92 xBZZ, and represents a continuation of the upwards trend following the low point in April.
Monthly Average Win Values
This metric is the average win amount for each win event.
| Month | Average Win Values (xBZZ) |
|---|---|
| January | 51.20 |
| February | 54.42 |
| March | 34.96 |
| April | 25.43 |
| May | 36.56 |
| June | 37.07 |

Analysis
Average win values followed a similar pattern to median win values, with a slight increase over the previous month from 36.56 xBZZ to 37.07 xBZZ.
Active Staking Node Monthly Average Earnings
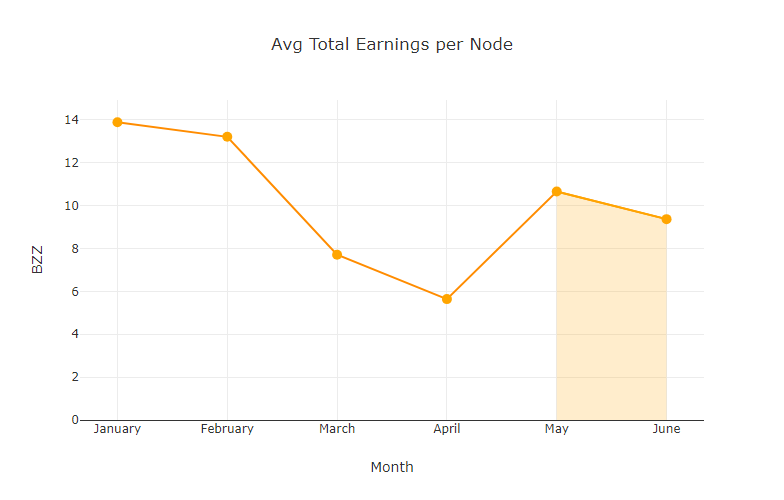
This metric shows the average monthly earnings for an active staking node (with an “active node” defined as a node which has submitted a commit transaction at least once in the month).
| Month | Avg Total Earnings per Node (xBZZ) |
|---|---|
| January | 13.89 |
| February | 13.21 |
| March | 7.71 |
| April | 5.64 |
| May | 10.66 |
| June | 9.37 |
Analysis
There was a slight decrease in average total earnings per node in June from 10.66 xBZZ to 9.37 xBZZ per node, which is reflective of rewards being spread amongst a greater number of nodes due to the increase in active nodes this month.
Total Active Staking Nodes by Month
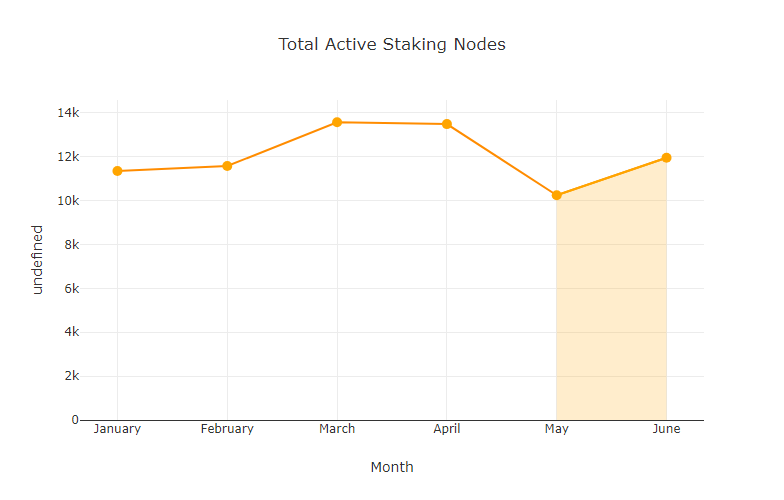
This metric shows the total active staking nodes by month (as defined by unique overlays which have issued a commit transaction at least once within the month).
| Month | Total Active Staking Nodes |
|---|---|
| January | 11,350 |
| February | 11,576 |
| March | 13,571 |
| April | 13,486 |
| May | 10,245 |
| June | 11,950 |
Analysis
June saw a moderate increase in the number of total active staking nodes over May up from 10,245 to 11,950.
Total Reachable Full Nodes Regardless of Active Status
This metric has been recorded since May 2024, and it reports the total number of unique reachable full nodes, regardless of whether or not they have issued a commit transaction within the month. This metric can help offer a fuller picture of network activity compared with the “active staking node” metric which only counts nodes that have submitted a commit transaction during the month (it may also however potentially represent an over-count of nodes, as it records even nodes which were only reachable momentarily during the month).
| Month | Total Reachable Full Nodes |
|---|---|
| May | 16,000 |
| June | 18,916 |
Analysis
In June there were 18,916 unique full nodes with reserve size greater than zero which were reachable at least once throughout the month, which represents a moderate increase over the previous month’s figure of 16,000 nodes.
Total Winning Nodes by Month
This metric shows the total number of unique active staking nodes which have won at least once within the month.
| Month | Total Winning Nodes |
|---|---|
| January | 2,474 |
| February | 2,814 |
| March | 2,413 |
| April | 2,486 |
| May | 2,554 |
| June | 2,680 |
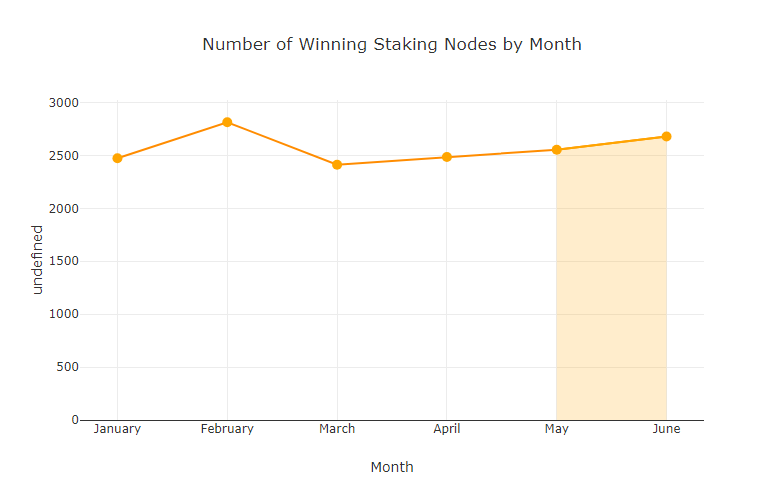
Analysis
The number of winning nodes increased slightly from January to February, increasing from 2,554 to 2,680 nodes.
Total Active Staking Nodes by Country
This metric shows the total number of active staking nodes across the top four countries and all other countries aggregated into the “Other” category, as well as the remaining nodes in the “Unknown” category.
| China | Germany | Finland | Unknown | United States | Other | |
|---|---|---|---|---|---|---|
| January | 6,696 | 1,937 | 1,769 | 701 | 181 | 66 |
| February | 6,787 | 1,958 | 1,952 | 688 | 116 | 75 |
| March | 7,785 | 1,953 | 2,232 | 1,408 | 91 | 102 |
| April | 7,249 | 1,912 | 2,291 | 1,851 | 92 | 91 |
| May | 6,014 | 1,671 | 2,075 | 339 | 83 | 63 |
| June | 7,480 | 1,718 | 2,276 | 370 | 79 | 27 |
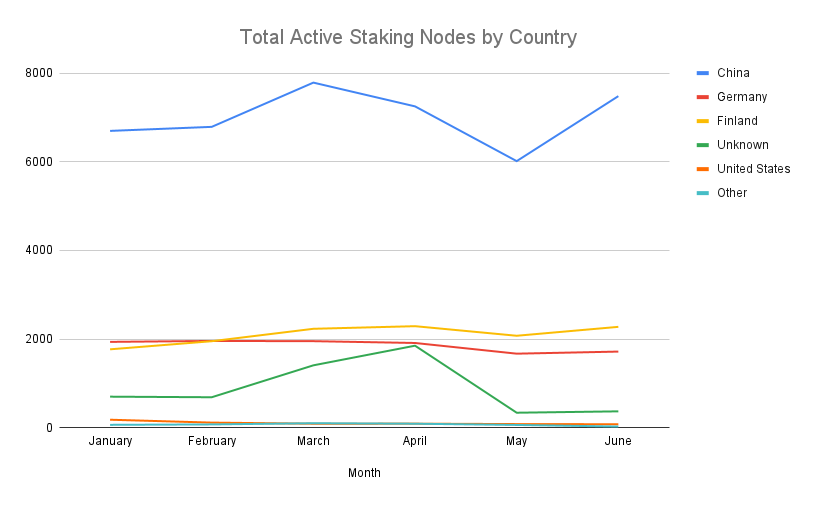
Analysis
China saw the greatest increase in active nodes during June, followed by more modest increases from Germany, Finland, and the Unknown category. A decrease in active nodes was observed in the United States and Other categories.
Conclusion
The analysis of these metrics provides a comprehensive view of the network’s performance and activity trends over the first half of the year. While there were fluctuations in rewards, win values, and node activity, the overall trends in data reflect the resilience and adaptability of the network.
Discussions about Swarm can be found on Reddit.
All tech support and other channels have moved to Discord!
Please feel free to reach out via info@ethswarm.org
Join the newsletter! .