
In our latest monthly report, we examine the performance of the Swarm network for January, continuing our ongoing analysis of the network’s dynamics. This month, we again report on key metrics such as total network rewards, win values, active staking nodes, and geographic distribution of nodes to understand the network’s current state and trends.
Network Total Monthly Rewards
This metric shows the total rewards paid out across the entire network for each month.
| Month | Total Network Rewards (xBZZ) |
|---|---|
| August | 135,927 |
| September | 147,825 |
| October | 152,868 |
| November | 148,617 |
| December | 159,865 |
| January | 157,596 |
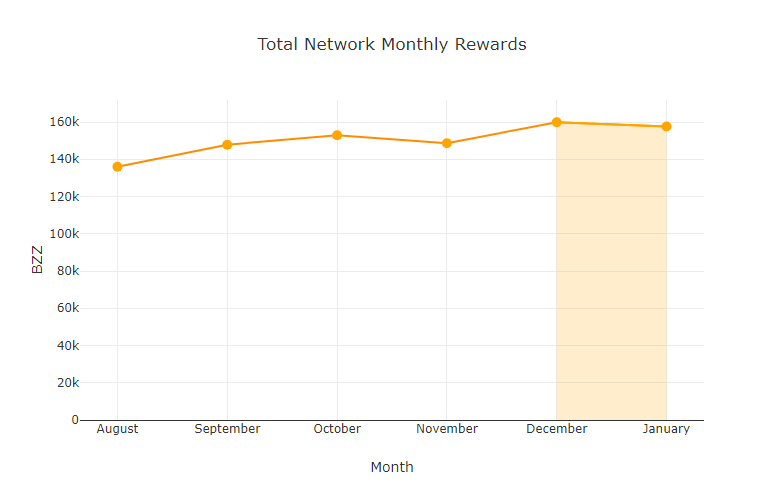
In January, the Swarm network distributed a total of 157,596 xBZZ in rewards to its node operators. This slight decrease from December’s record of 159,865 xBZZ perhaps indicates a stabilisation in network utilisation after the recent growth spurts. This metric remains a critical indicator of the network’s health and its capacity to incentivise participation.
Monthly Median Win Values
This metric is the median win amount for each win event.
| Month | Median Win Values (xBZZ) |
|---|---|
| August | 43.97 |
| September | 44.62 |
| October | 46.84 |
| November | 46.83 |
| December | 48.06 |
| January | 47.43 |
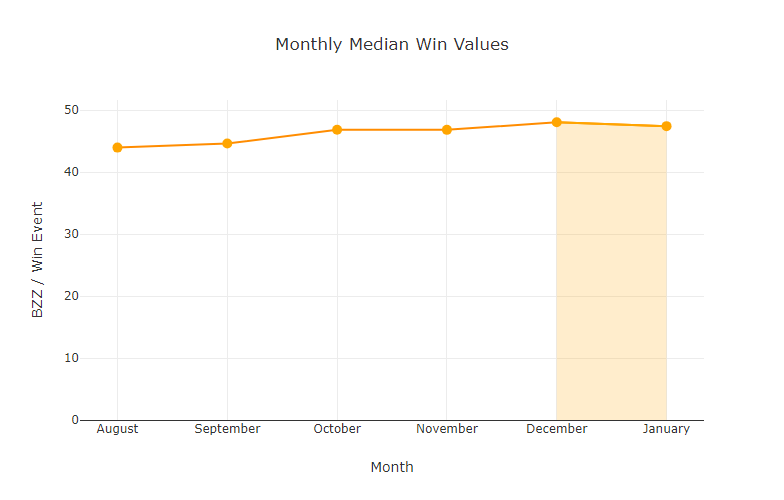
The median win value experienced a very slight decrease to 47.43 xBZZ in January from 48.06 xBZZ in December, falling into the range of values from recent months.
Monthly Average Win Values
This metric is the average win amount for each win event.
| Month | Average Win Values (xBZZ) |
|---|---|
| August | 41.45 |
| September | 46.52 |
| October | 62.09 |
| November | 47.41 |
| December | 57.75 |
| January | 51.20 |
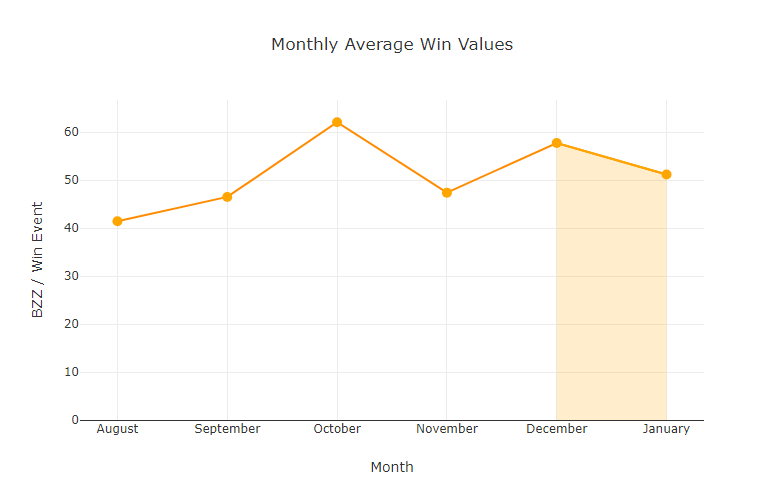
January saw the average win value adjust to 51.20 xBZZ, down from 57.75 xBZZ in December.
Active Staking Node Monthly Average Earnings
This metric shows the average monthly earnings for an active staking node.
| Month | Avg Total Earnings per Node (xBZZ) |
|---|---|
| August | 31.11 |
| September | 32.31 |
| October | 14.73 |
| November | 8.12 |
| December | 12.40 |
| January | 13.89 |
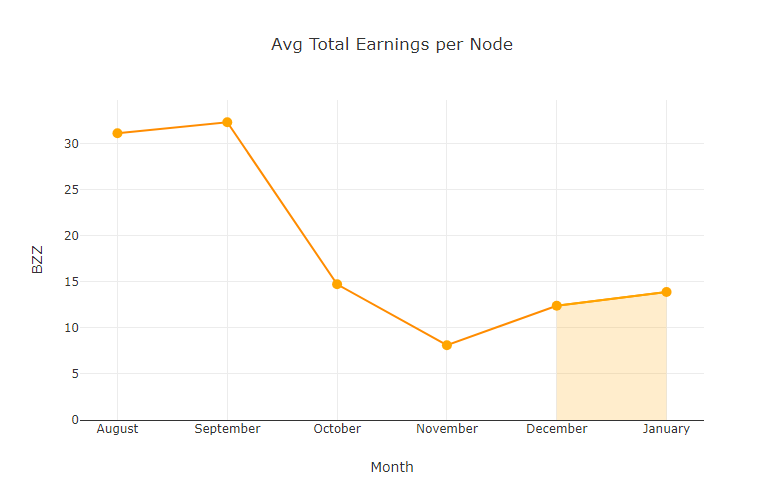 The average earnings per active staking node increased to 13.89 xBZZ in January. This rise, against a backdrop of a slight decrease in the total number of active staking nodes, illustrates the network’s dynamic self-adjusting economic model.
Total Active Staking Nodes by Month
This metric shows the total active staking nodes by month. “Active nodes” are nodes which have submitted a commit transaction at least once within the month (this metric does not measure nodes which have been actively participating in neighbourhoods not chosen within the month).
| Month | Total Active Staking Nodes |
|---|---|
| August | 4,368 |
| September | 4,574 |
| October | 10,367 |
| November | 20,868 |
| December | 12,891 |
| January | 11,350 |
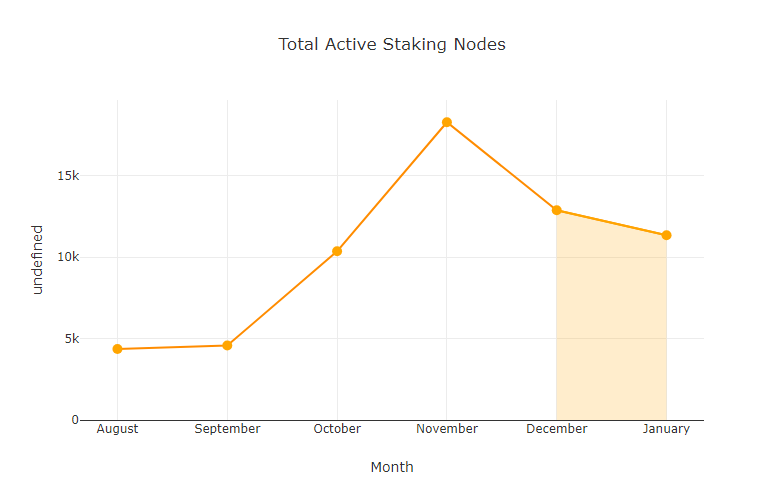
January’s active staking nodes decreased to 11,350 from December’s 12,891. This reduction possibly indicates tighter competition among node operators.
Total Winning Nodes by Month
This metric shows the total number of unique active staking nodes which have won at least once within the month.
| Month | Total Winning Nodes |
|---|---|
| August | 1,993 |
| September | 2,125 |
| October | 2,462 |
| November | 2,787 |
| December | 2,308 |
| January | 2,474 |
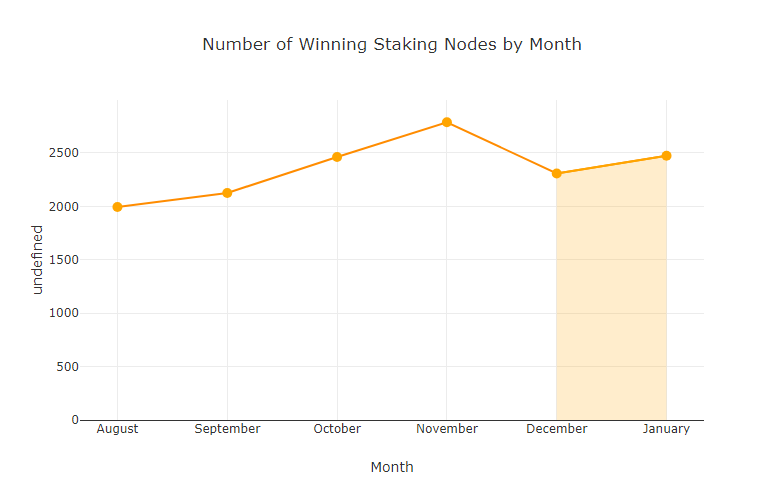
The total number of unique active staking nodes that won at least once rose to 2,474 in January from 2,308 in December.
Total Active Staking Nodes by Country
This metric shows the total number of active staking nodes across the top four countries and all other countries aggregated into the “Other” category, as well as the remaining nodes in the “Unknown” category.
| China | Germany | Finland | Unknown | United States | Other | |
|---|---|---|---|---|---|---|
| August | 855 | 1,481 | 1,611 | 267 | 7 | 147 |
| September | 574 | 2,046 | 1,607 | 217 | 8 | 123 |
| October | 6,242 | 2,042 | 1,543 | 175 | 282 | 91 |
| November | 16,145 | 2,225 | 1,961 | 37 | 363 | 137 |
| December | 8,333 | 2,001 | 1,919 | 265 | 312 | 61 |
| January | 6,696 | 1,937 | 1,769 | 701 | 181 | 66 |
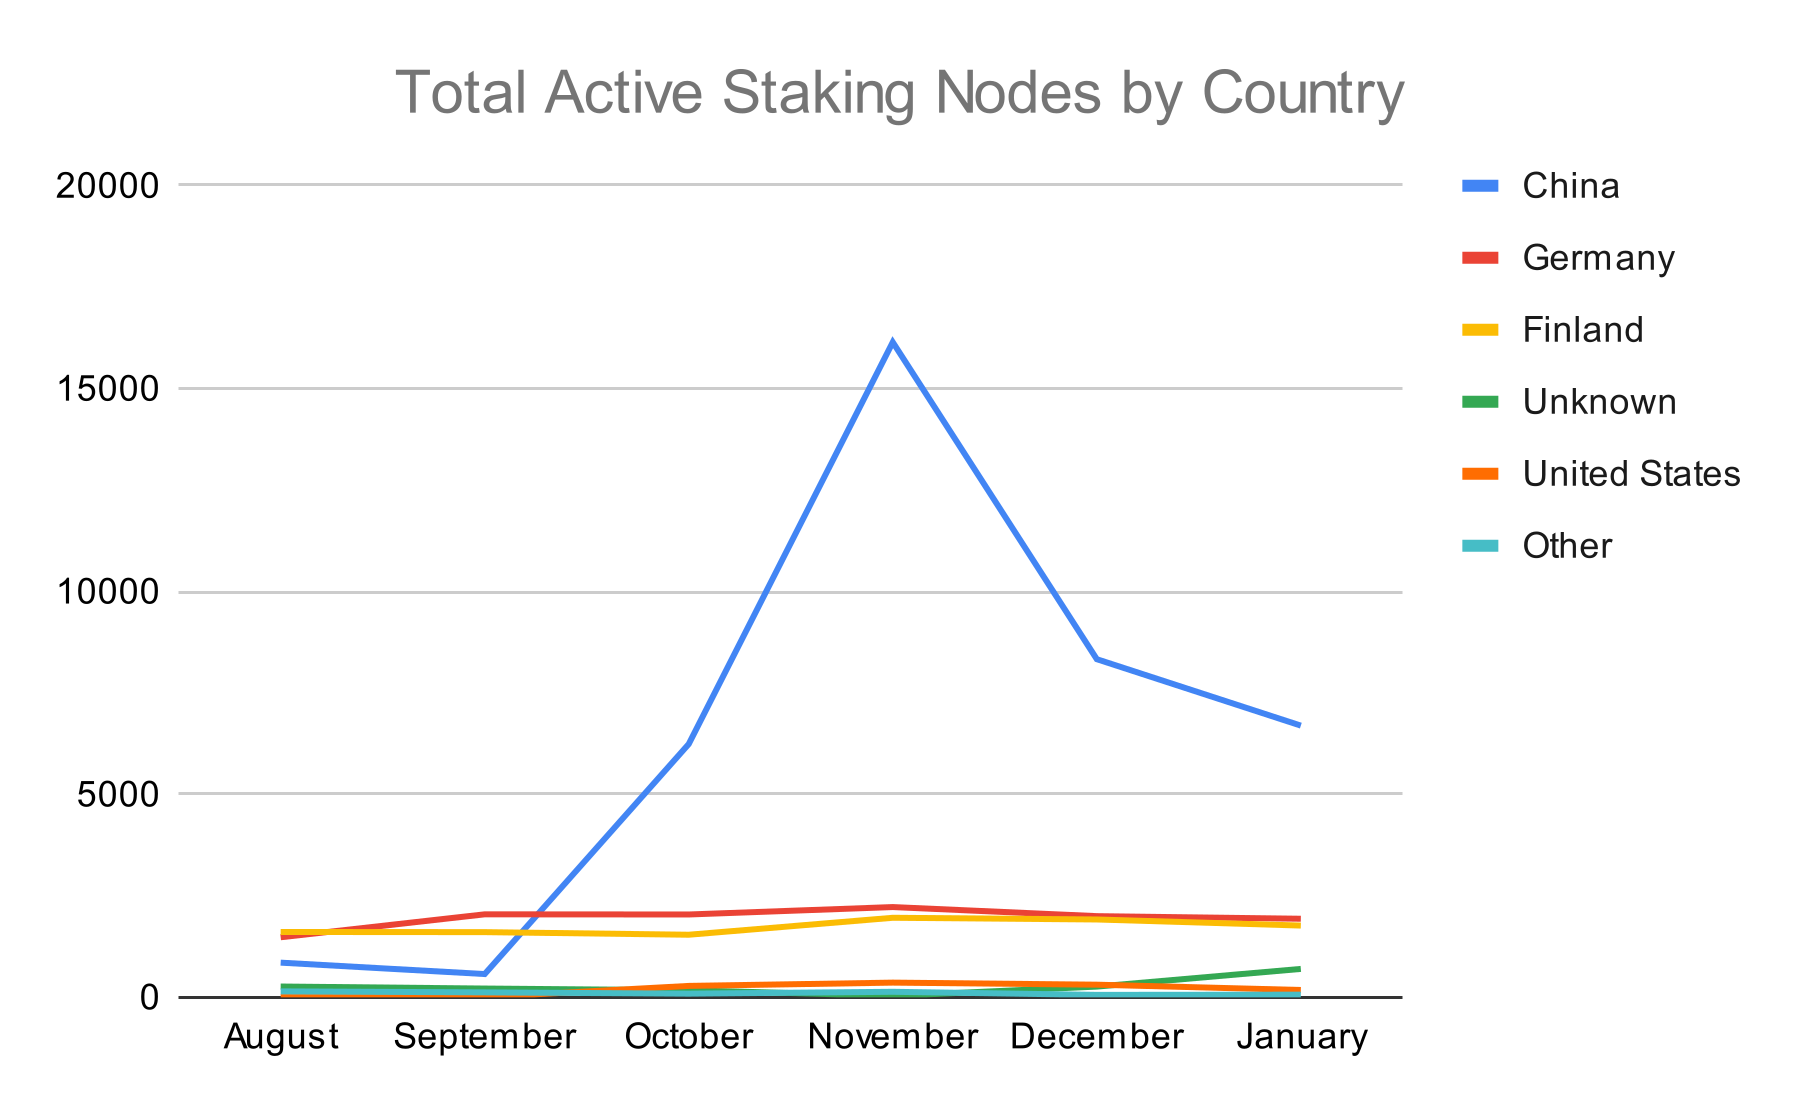
January showed a slight reshuffling in the geographic distribution of active staking nodes, with a decrease in nodes from China and adjustments in other regions.
Conclusion
January’s data for the Swarm network perhaps indicates a period of stabilisation and maturation, with trends in rewards, node participation, and geographical distribution showing subtle adjustments rather than dramatic shifts. The slight decrease in total rewards and active nodes, alongside an increase in average earnings per node, suggests a more efficient allocation of resources within a competitive ecosystem. Moreover, the evolving geographic distribution of nodes highlights Swarm’s continuing global reach.
Discussions about Swarm can be found on Reddit.
All tech support and other channels have moved to Discord!
Please feel free to reach out via info@ethswarm.org
Join the newsletter! .