Introduction
This report provides an overview of the Swarm network’s key metrics for August 2024, highlighting changes in network rewards, win values, node activity, and geographic distribution. By comparing these metrics to previous months, we can better understand the ongoing development of the network.
Network Total Monthly Rewards
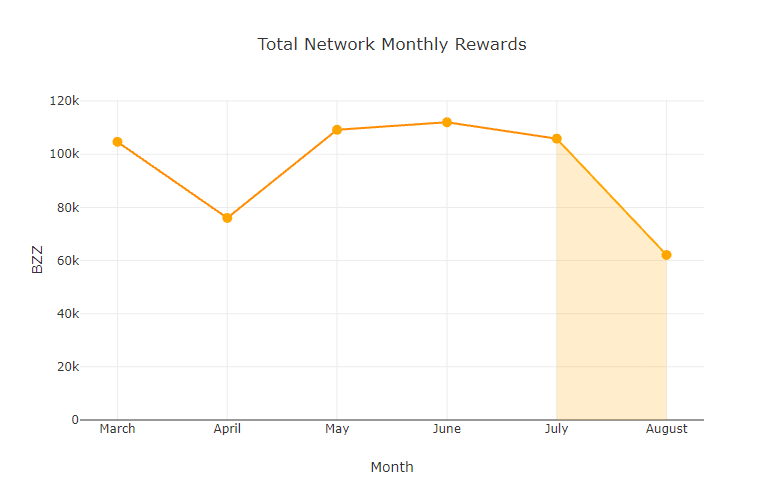
This metric shows the total rewards paid out across the entire network for each month.
| Month | Total Network Rewards (xBZZ) |
|---|---|
| March | 104,657 |
| April | 76,024 |
| May | 109,209 |
| June | 112,037 |
| July | 105,855 |
| August | 62,093 |
Commentary
In August, the total network rewards saw a sharp decline, dropping to 62,093 xBZZ from 105,855 xBZZ in July. This is likely tied to an overall decrease in postage stamp batch purchases / expiration of postage stamp batches.
Monthly Median Win Values
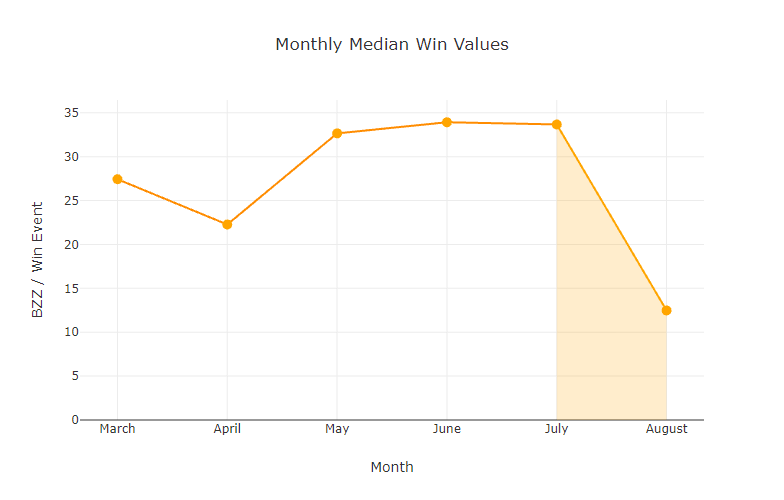
This metric is the median win amount for each win event.
| Month | Median Win Values (xBZZ) |
|---|---|
| March | 27.43 |
| April | 22.27 |
| May | 32.65 |
| June | 33.92 |
| July | 33.67 |
| August | 12.48 |
Commentary
The median win value experienced a considerable drop in August. The median win value fell from 33.67 xBZZ to 12.48 xBZZ. These reductions point to lower values for reward events, likely tied to the overall decrease in postage stamp batch purchases / expiration of postage stamp batches.
Monthly Average Win Values
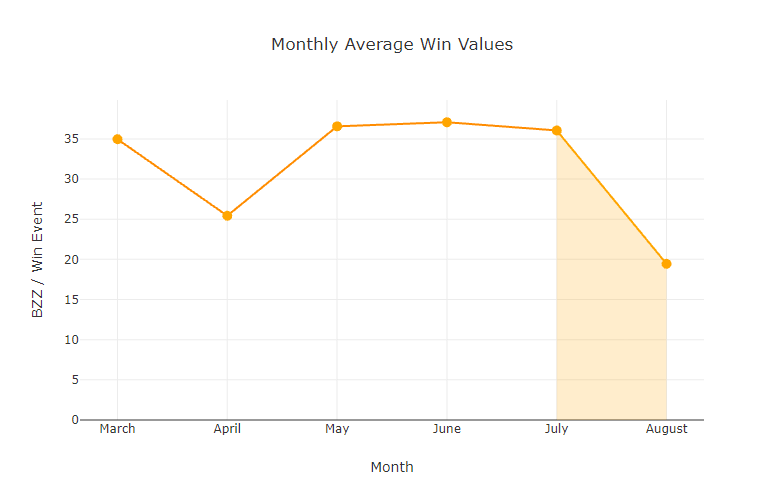
This metric is the average win amount for each win event.
| Month | Average Win Values (xBZZ) |
|---|---|
| March | 34.96 |
| April | 25.43 |
| May | 36.56 |
| June | 37.07 |
| July | 36.05 |
| August | 19.44 |
Commentary
The average win values decreased significantly in August, from 36.05 xBZZ in July to 19.44 xBZZ. This follows the broader trend across the network.
Active Staking Node Monthly Average Earnings
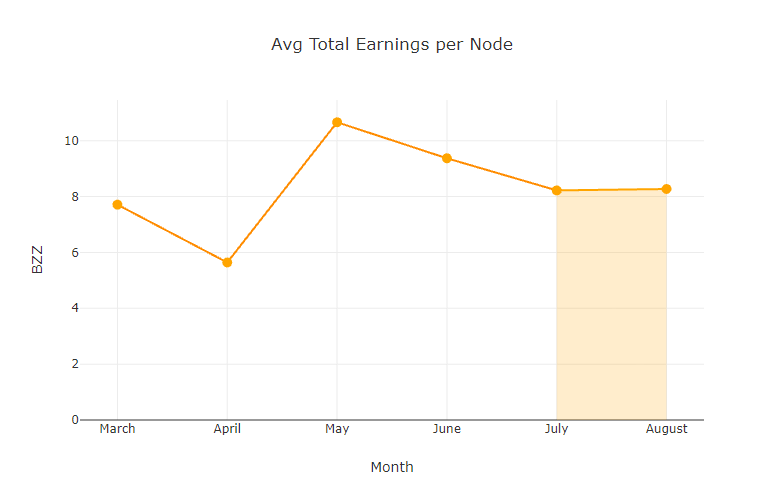
This metric shows the average monthly earnings for an active staking node (with an “active node” defined as a node which has submitted a commit transaction at least once in the month).
| Month | Avg Total Earnings per Node (xBZZ) |
|---|---|
| March | 7.71 |
| April | 5.64 |
| May | 10.66 |
| June | 9.37 |
| July | 8.22 |
| August | 8.27 |
Commentary
Interestingly, the average earnings per active staking node remained relatively stable, increasing slightly from 8.22 xBZZ in July to 8.27 xBZZ in August. This suggests that while the total rewards dropped, the distribution across active nodes was more concentrated. This is likely due to the fact that the total number of active nodes has decreased in August, and is an illustration of Swarm’s self adjusting economic model in action.
Total Active Staking Nodes by Month
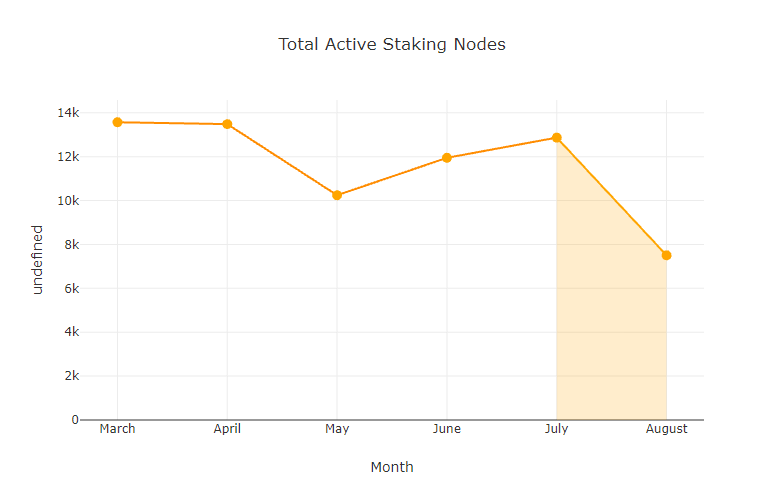
This metric shows the total active staking nodes by month (as defined by unique overlays which have issued a commit transaction at least once within the month).
| Month | Total Active Staking Nodes |
|---|---|
| March | 13,571 |
| April | 13,486 |
| May | 10,245 |
| June | 11,950 |
| July | 12,871 |
| August | 7,506 |
Commentary
The total number of active staking nodes experienced a sharp decline, falling from 12,871 in July to 7,506 in August.
Total Reachable Full Nodes Regardless of Active Status
This metric has been recorded since May 2024, and it reports the total number of unique reachable full nodes, regardless of whether or not they have issued a commit transaction within the month. This metric can help offer a fuller picture of network activity, as some minority of nodes will be actively operating in neighborhoods which were not chosen to play the redistribution game during the month (it may also, however, potentially represent an over-count of nodes, as it records even nodes which were only reachable momentarily at one point during the month).
| Month | Total Reachable Full Nodes |
|---|---|
| May | 16,000 |
| June | 18,916 |
| July | 20,898 |
| August | 24,168 |
Commentary
Interestingly, despite the decline in active staking nodes, the total number of reachable full nodes in August continued its upward trajectory, spiking up to 24,168.
Total Winning Nodes by Month
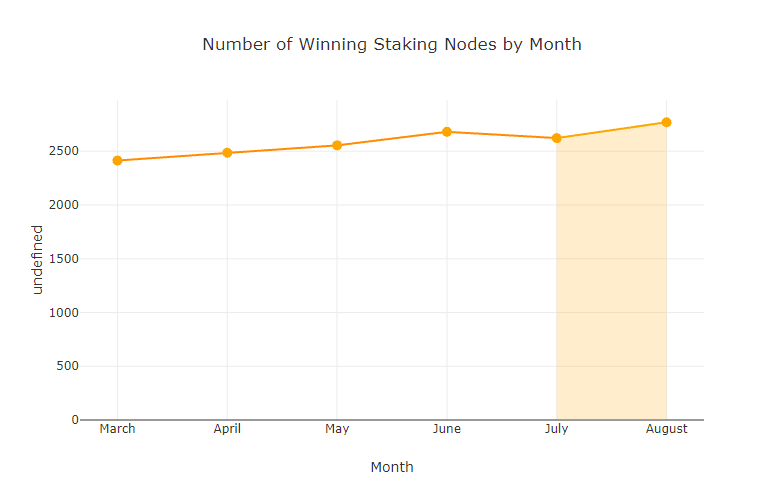
This metric shows the total number of unique active staking nodes which have won at least once within the month.
| Month | Total Winning Nodes |
|---|---|
| March | 2,413 |
| April | 2,486 |
| May | 2,554 |
| June | 2,680 |
| July | 2,622 |
| August | 2,769 |
Commentary
The total number of winning nodes increased from 2,622 in July to 2,769 in August, even as overall rewards decreased. This could possibly indicate that rewards were more evenly distributed than in previous months.
Total Active Staking Nodes by Country
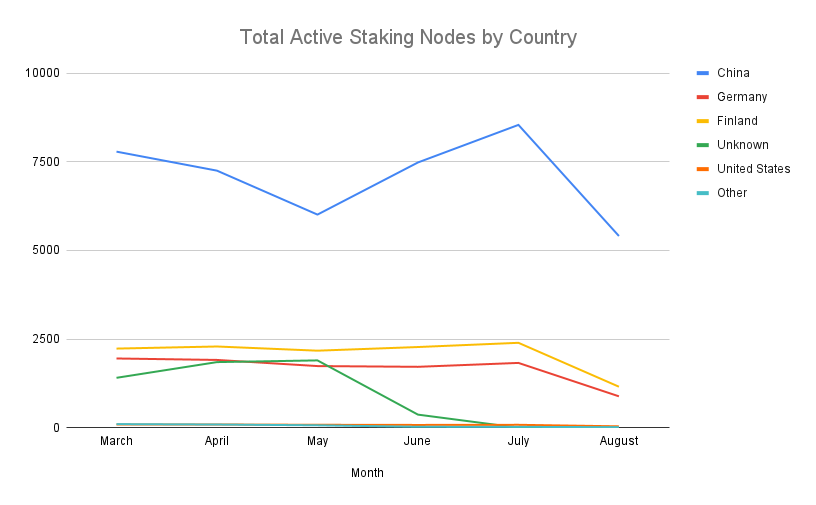
This metric shows the total number of active staking nodes across the top four countries and all other countries aggregated into the “Other” category, as well as the remaining nodes in the “Unknown” category.
| China | Germany | Finland | Unknown | United States | Other | |
|---|---|---|---|---|---|---|
| March | 7,785 | 1,953 | 2,232 | 1,408 | 91 | 102 |
| April | 7,249 | 1,912 | 2,291 | 1,851 | 92 | 91 |
| May | 6,010 | 1,739 | 2,173 | 1,899 | 84 | 69 |
| June | 7,480 | 1,718 | 2,276 | 370 | 79 | 27 |
| July | 8,539 | 1,828 | 2,395 | 1 | 83 | 25 |
| August | 5,406 | 886 | 1,157 | 1 | 40 | 16 |
Commentary
Geographically, China remained the leading region for active staking nodes, though its numbers dropped significantly. Germany and Finland also saw decreases, while the United States and Other regions remained small in comparison.
Conclusion
August saw significant shifts within the Swarm network, most notably a sharp decline in total rewards and win values alongside a reduction in active staking nodes. However, the number of reachable full nodes continued to grow, signaling a robust overall network presence despite decreased rewards distribution. These trends suggest a period of adjustment within the network, with broader implications for future network stability and participation. Interestingly, the average earnings per node have remained relatively stable, which could indicate the effectiveness of Swarm’s self adjusting economic model.
Discussions about Swarm can be found on Reddit.
All tech support and other channels have moved to Discord!
Please feel free to reach out via info@ethswarm.org
Join the newsletter! .

